Bespoke CNBC Appearance (12/29)
Bespoke co-founder Paul Hickey appeared on CNBC’s Squawk Box this morning to discuss the market outlook and Taco Bell. To view the segment, click on the image below. Click here to view Bespoke’s premium membership options for our best research available.

Golden Crosses Abound in Energy
Since mid-November, the Energy sector (XLE) has consistently traded above its moving averages. While it has pulled back a bit recently, XLE’s moving averages have continued to move higher. In fact, today XLE is setting up to experience a golden cross. A golden cross is when an upwards trending 50-DMA moves above an upwards trending 200-DMA.

Not only is the sector ETF potentially about to experience a golden cross, but it will be the first time in a long time that the 50-DMA has even traded above the 200-DMA. As shown below, the last time that XLE’s 50-DMA was above its 200-DMA on a closing basis was way back in November of 2018, 537 trading days ago. Since XLE began trading in the late 1990s, that is the longest stretch on record in which the shorter-term moving average has been below the longer-term 200-DMA. The next longest streak ended at 389 days in May of 2016.

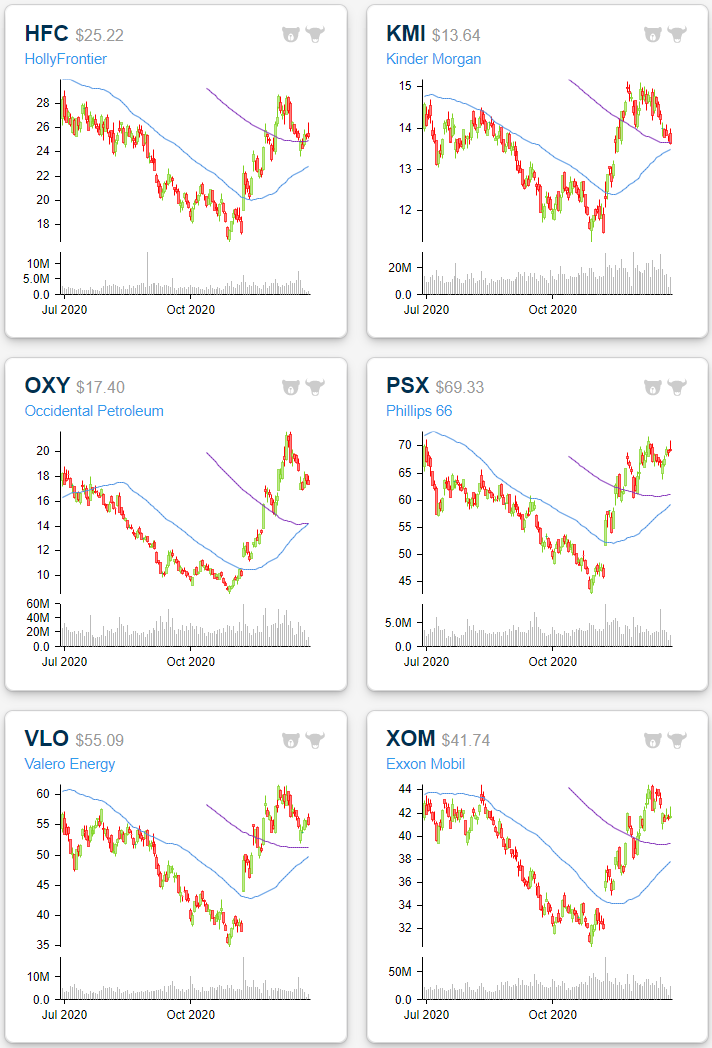
As for the individual stocks of the sector, there are many charts that are showing a similar trend. Each day in our Chart Scanner and Trend Analyzer tools, we highlight recent golden crosses. As recently as last Thursday, Chevron (CVX), EOG Resources (EOG), National Oilwell Varco (NOV), and Transocean (RIG)—not an S&P 500 member and as such not included below—all made their way onto the screen. Looking across other S&P 500 Energy names, there have been several other recent golden crosses like Apache (APA), Diamondback Energy (FANG), and ConocoPhillips (COP).
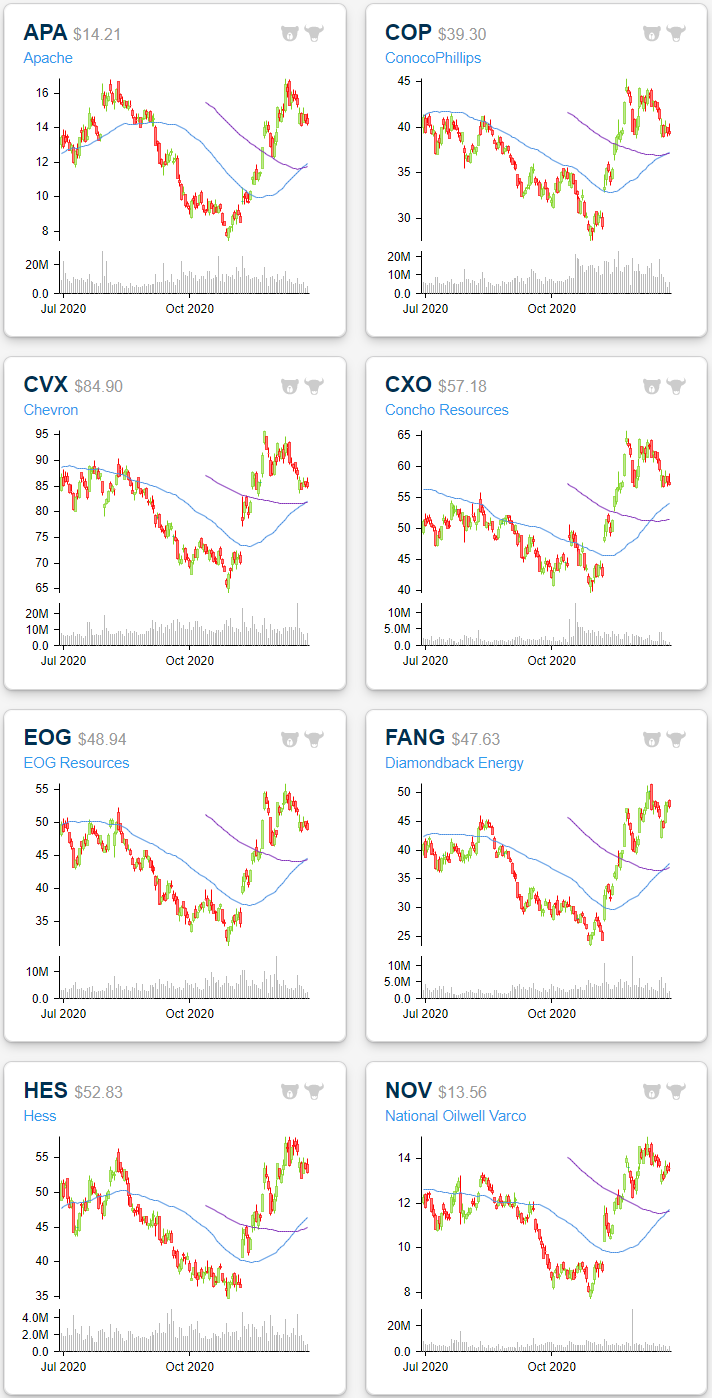
As those stocks have completed the pattern, there are still others that are getting close to experiencing a golden cross. Perhaps the closest is Occidental Petroleum (OXY) whose 50-DMA was just 5 cents below its 200-DMA as of yesterday’s close. As for other stocks in the sector, names like Kinder Morgan (KMI) and Exxon Mobil (XOM) have further to go but generally have their moving averages trending in the right directions. Click here to view Bespoke’s premium membership options for our best research available.
Bespoke’s Morning Lineup – 12/29/20 – More Records
See what’s driving market performance around the world in today’s Morning Lineup. Bespoke’s Morning Lineup is the best way to start your trading day. Read it now by starting a two-week free trial to Bespoke Premium. CLICK HERE to learn more and start your free trial.
“Simple can be harder than complex: You have to work hard to get your thinking clean to make it simple.” – Steve Jobs
Major US equity indices are on pace to open at new record highs this morning after futures have traded higher all night. Over in Japan, the Nikkei traded to its best level in more than three decades, and European equities are also trading higher. Treasuries, on the other hand, have seen a bit of selling pressure as yields are modestly higher. There’s little data again this morning, so if the market is going to focus on anything, it will be how the Senate reacts to the passage of a measure in the House to increase the already passed $600 relief payments up to $2,000.
Be sure to check out today’s Morning Lineup for updates on the latest market news and events, an update on the latest national and international COVID trends, and much more. Also, if you’re near a TV, check us out on CNBC’s Squawk Box this morning at 8:50 AM Eastern.

While equities are poised to open at record highs, US Treasuries have been stuck in a steady downtrend for months now. The charts below of the US Treasury Long Bond future show its daily performance over the last six months (top) and the intraday performance over the last fifteen trading days (bottom). A quick look shows two similar trends – a steady stream of lower highs. If you look a little closer at the intraday chart at the bottom, though, the Long Bond future showed some signs yesterday of attempting to break its downtrend. Yields are higher this morning, so at the outset, there won’t be any follow-through to yesterday’s test, but if prices reverse course and rally today, there just might be a contra-trend rally to close out the year heading into 2021.

Chart of the Day: Cathie’s ARK
Daily Sector Snapshot — 12/28/20
Under the Hood Strength in Texas
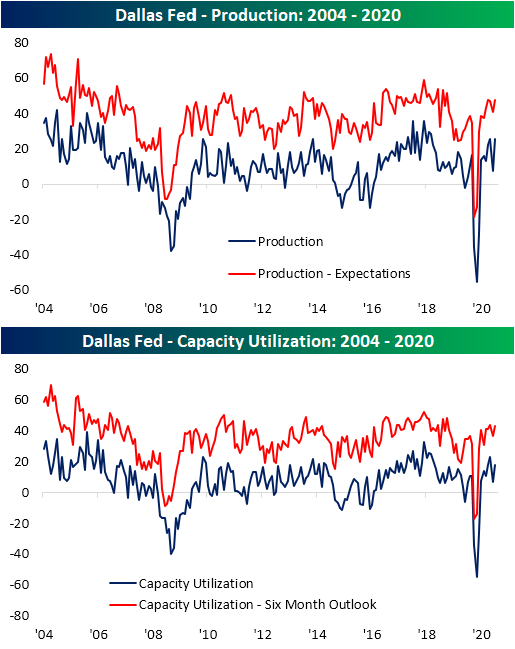
This morning the Dallas Fed released its monthly reading on the region’s manufacturing sector. The headline number was expected to fall for the second month in a row from the October high of 19.8; the highest reading since October of 2018. While that decline came to fruition, it was an even bigger drop than what was expected as the index fell to 9.7 compared to the forecast of 11.6. Although the index was lower, December marked the fifth month in a row with expansionary conditions.

Although the index for General Business Activity fell, the rest of the report saw much more strength. Other than Finished Good Inventories, every index continued to show expansionary readings with many moving higher month over month. A few indices have even risen into the top decile of historical readings.
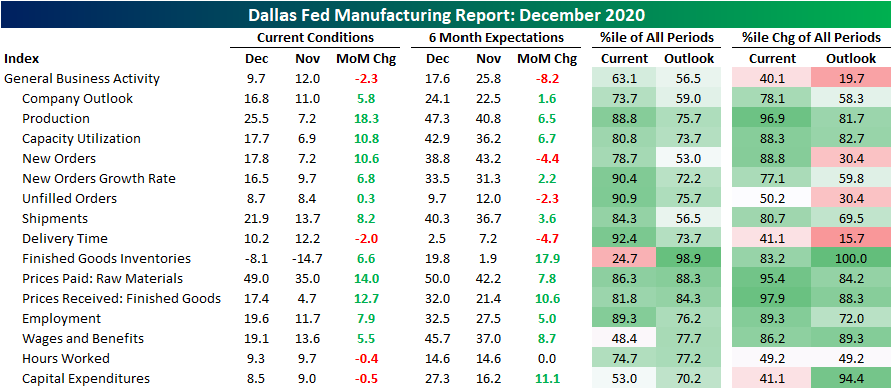
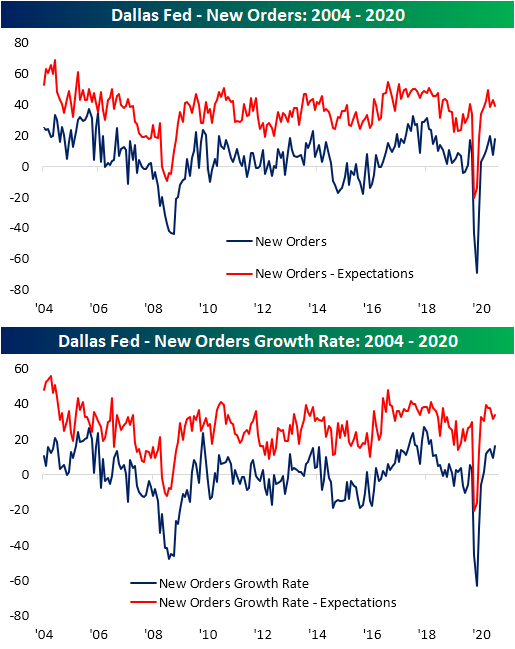
Demand appeared to have picked up in December with the index for New Orders and New Order Growth Rate both rising month over month. While the index for New Orders is still just below its post-pandemic peak of 19.9 from October, the New Order Growth Rate has risen to its highest level since August of 2018.
Given demand has continued to rise, Dallas area manufacturers have also appeared to have increased production in a big way in December. The Production index rose back up to 25.5, matching the pandemic high from October. Before that, you would need to go back to August of 2018 to find as high of a reading. Additionally, the 18.3 point increase from last month was the largest move since May and June and is tied with December of 2017 for the sixth-largest monthly gain on record. Given production has increased so too has Capacity Utilization, though this index’s moves were not as dramatic as it still sits below highs from a few months ago.
While most indices of the report saw some type of pause in their moves higher in recent months, prices have been on a one-way trip higher. Prices Paid for Raw Materials accelerated for the fifth month in a row reaching the highest level in over two years. Expectations for prices of inputs have similarly been elevated relative to recent history as that index rose to a reading of 50 in December; the highest since May of 2018. Those price increases are flowing into the price of finished goods as the index for Prices Received rose another 12.7 points to 17.4. Again, this was the highest reading since the summer of 2018 and the index for future expectations also reached a new high.

Wages were also on the rise in December as the index rose to 19.1. That is the highest level since right before the pandemic began in February. Expectations on the other hand are at the highest level since March of last year. Those increases in wages and benefits come as businesses, in general, raise employment levels. The index for employment gained another 7.9 points moving to a two-year high of 19.6. While more people are being taken on with better compensation, the index for hours worked fell slightly in December. Click here to view Bespoke’s premium membership options for our best research available.
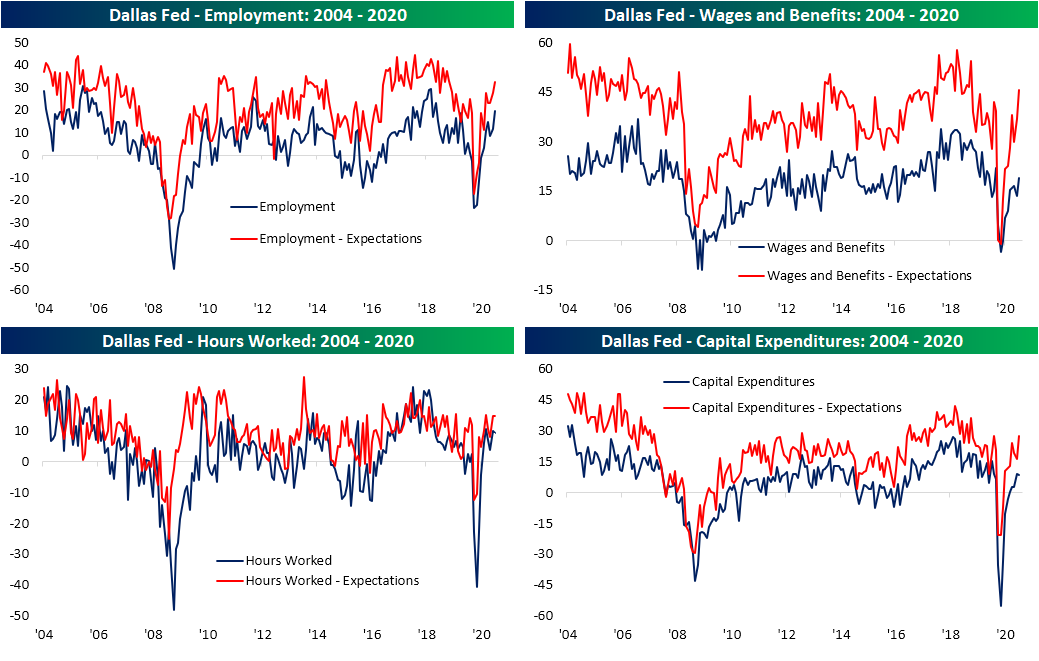
Chart of the Day: Strong Quarters, Strong Finish?
Bespoke’s Morning Lineup – 12/28/20 – Stimulated Open
See what’s driving market performance around the world in today’s Morning Lineup. Bespoke’s Morning Lineup is the best way to start your trading day. Read it now by starting a two-week free trial to Bespoke Premium. CLICK HERE to learn more and start your free trial.
“Business opportunities are like buses, there’s always another one coming.” – Richard Branson
After a long holiday weekend, US equity markets are open for just four days again this week as Friday is New Years Day. This is the only time of year that you get two three-day weekends in a row for the market, and it doesn’t even happen every year. In fact, with New Years Day falling on a Saturday next year, there will be no market holiday in observance of New Years Day either the Friday before or the Monday after.
Markets are kicking off the week on a positive note as President Trump finally signed the COVID relief bill. The only economic data point on the calendar is the Dallas Fed at 10:30 eastern. The rest of the week looks to be quiet- at least in terms of scheduled data.
Be sure to check out today’s Morning Lineup for updates on the latest market news and events, an update on the latest national and international COVID trends, and much more.
After a period of consolidation last week, global equities are looking to end the last four trading days of the year on a positive note. The snapshot below from our Trend Analyzer tool shows international regional ETFs and summarizes their performance as well as where they currently stand relative to their trading ranges. Of the 18 ETFs shown, the only one that finished higher last week was the European Hedged Equity ETF (HEDJ). ETFs which saw the largest pullbacks last week were Latin America (ILF), Emerging Markets (VWO & EEM), and Asia ex-Japan (AAXJ). Despite the losses, though, every ETF shown finished the week above its 50-day moving average, and most were overbought as well.

Bespoke Brunch Reads: 12/27/20
Welcome to Bespoke Brunch Reads — a linkfest of the favorite things we read over the past week. The links are mostly market related, but there are some other interesting subjects covered as well. We hope you enjoy the food for thought as a supplement to the research we provide you during the week.
While you’re here, join Bespoke Premium with a 30-day free trial!
Pandemic Stories
‘Vodka in Your Coffee Cup’: When Pandemic Drinking Goes Too Far by Alix Strauss (NYT)
The rise in alcohol consumption during the pandemic – driven by boredom, isolation, and a need to self-medicate – is leading to concerns over a new rise in alcohol abuse among demographics that don’t traditionally get a lot of attention for substance issues. [Link; soft paywall]
Dogs ease pandemic isolation for nursing home residents by Mary Esch (AP)
Nursing home residents who are isolated from family and the rest of the outside world thanks to COVID are finding relief in the form of four-legged friends who can offer companionship. [Link]
Only the world wars have rivalled covid-19 for news coverage (The Economist)
Almost half of the stories published in the New York Times and The Economist mention coronavirus in 2020, a share only rivalled by “war” during the periods of the First and Second World Wars. [Link; registration required]
In pandemic America’s tent cities, a grim future grows darker by Michelle Conlin (Reuters)
The surge in houselessness and difficulty providing relief through traditional programs means that tent cities are spreading and growing rapidly across the entire country. [Link]
Culture Wars
Why British Kids Went Back to School, and American Kids Did Not by Chris Cook (The Atlantic)
Strong unions and decentralized decision making have kept American teachers from being subject to the same risks as European teachers, while students in the UK and EU have missed little in-person instruction unlike the US. Despite objection from teachers, Europe also reached a consensus on schools…unlike the US, where policy became deeply politicized. [Link; soft paywall]
Does Affective Polarization Undermine Democratic Norms or Accountability? Maybe Not by David Broockman, Joshua Kella, and Sean Westwood (OSF Pre-Prints)
A new paper argues that polarization does not celebrate norm violations, lower political candidate quality, reduce compromise, and lead to misperception of actual conditions. Instead, “affective polarization” are generally limited to everyday life, not the political realm. [Link]
Gold Rushes
Agriculture Industry Bets on Carbon as a New Cash Crop by Jacob Bunge (WSJ)
Farmers are being paid to use their fields as carbon sinks, but there are questions about the practice that a desire to offset carbon emissions incentivizes. [Link; paywall]
Betting companies defined the year in sports business by Daniel Roberts (Yahoo!)
While sports themselves were badly impacted by COVID, sports betting businesses had an unprecedented boom that may be here for a long time to come. [Link; auto-playing video]
Covid-19 Propelled Businesses Into the Future. Ready or Not. by Greg Ip (WSJ)
E-commerce has been given a massive boost by COVID-19 in a boon to companies that moved quickly to offer a digital version of traditionally physical or in-person transactions. [Link; paywall]
Tech
Exclusive: Apple targets car production by 2024 and eyes ‘next level’ battery technology – sources by Stephen Nellis, Norihiko Shirouzu, and Paul Lienert (Reuters)
Apple’s long-rumored Project Titan continues in the dark, with the company aiming for a 2024 production date. The company is looking to build a passenger vehicle that might include “breakthrough” battery tech that would reduce cost and increase range. [Link; auto-playing video]
How Amazon Wins: By Steamrolling Rivals and Partners by Dana Mattioli (WSJ)
As the online retailer has expanded in scale, it has repeatedly entered relatively small markets and smashed competitors with its efficiency. [Link; paywall]
Taiwan’s TSMC begins hiring blitz for $12bn US plant by Cheng Ting-Fang and Lauly Li (Nikkei Asia)
The world’s largest chipmaker is building a large fabrication facility for its 5 nanometer chips in Arizona and is set to start hiring hundreds of engineers and other plant staff as it nears the start of operations. [Link]
Markets
Flash Surge in World’s Biggest ETF Linked to ‘Outlandish’ Trades (Bloomberg)
A fat finger trade in SPY led to more than 150,000 trades totaling over $50mm took less than 1 second to play out, driven by an order that ignored potentially lower prices in order to quickly fill demand. Either the choice of order or its high price are likely the result of human order. [Link; soft paywall]
A Speculative Frenzy Is Sweeping Wall Street and World Markets (Bloomberg/Yahoo!)
Stimulative policy, enormous optimism about the outlook, and the easiest financial conditions in history are fueling staggering speculative activity in the US equity markets. [Link]
SEC Adopts New Ad Rule, Allows Client Testimonials by Melanie Waddell (ThinkAdvisor)
Changes to regulations related to advertising and marketing will allow advisors to start using testimonials and endorsements from clients. [Link]
NIMBYs
George Lucas sues family and town over Marin County property rights by Andrew Chamings (SFGate)
After anti-development forces prevented George Lucas from expanding his studio, he decided to build low-income housing on the plot. The result is an eight year battle between Lucas and neighbors who don’t want lower income people living in their community. [Link]
Read Bespoke’s most actionable market research by joining Bespoke Premium today! Get started here.
Have a great weekend!