Service Sector Improves But Not Without Problems
Tuesday’s release of the ISM’s reading on the manufacturing sector showed a significant acceleration in activity in the month of December. The service sector counterpart released today similarly showed activity grew at a more rapid pace in December, though, the improvement was not as dramatic as in the manufacturing sector. The headline index rose to a three-month high of 57.2 from 55.9 in November. On a combined basis and accounting for each sector’s share in the overall economy, the composite ISM for December rose 1.5 points to 57.6- the highest reading since July.

Although the headline index was higher, breadth in the Non-Manufacturing report was mixed. Half of the indices for the various categories were lower month over month with two of them, Backlog Orders and Employment, falling into contraction. Overall, the report showed service sector demand continued to grow in December, but lead times were longer and employment cut back for the first time since August.

The commentary section also painted a more mixed picture than the uptick in the headline number. A number of comments noted that recently implemented shutdowns and surges in COVID cases have had negative impacts on businesses ranging from weaker demand to labor shortages to supply and logistics issues.

Although many comments noted how COVID has recently impacted demand, December was all around a pretty good month. New Orders remain well off the highs from the late spring through the fall and are also below levels from prior to COVID, but December’s reading of 58.5 was nonetheless consistent with growth in order volumes. That marked a seventh consecutive month of growth (above 50) in New Orders and an acceleration versus November. Meanwhile, businesses have made progress in working off their backlog of orders. That index fell into contraction for the first time in six months, falling two points to 48.7. That is the lowest level in the Backlog Orders index since May

Given the further growth in demand, for only the third month in the history of the report—the other months being November and March of 2020—businesses reported inventory levels as being too low (readings below 50). In fact, at 47.7, the Inventory Sentiment index broke below the March reading of 47.8 for a new record low. Although businesses think inventories are too low, actual inventory levels rose at a historically high pace in December. After a contractionary reading in November, the Inventory index rose 8.9 points to 58.2 in December. That is the seventh-highest reading on record and the month over month increase stands in the top 1% of all monthly moves. While those two readings may seem counterintuitive, some comments highlighted by ISM give some color into inventories. A comment from one business noted that the business was “Building inventory when and where possible to mitigate supply chain risks like supplier plant disruptions, carrier-related delays, and the holidays” while another noted that “Inventories were previously too low.” In other words, rather than weakened demand, the build up of inventories was likely in order to get in front of foreseen supply issues down the road and to make up for previously weak inventory levels.

There is evidence of supply issues after all. As previously noted, comments from surveyed businesses made frequent mentions of issues with supply chains and lead times. The index for Supplier Deliveries backs this up. Higher readings in this index indicate longer lead times, and in December, the index jumped 5.8 points to the highest level since May. That increase was the sixth-largest MoM jump on record, and in terms of the level of the index, it was the fourth-highest reading on record. Click here to view Bespoke’s premium membership options for our best research available.

Chart of the Day: Polarization Right On Cue
PUA Plunge
After falling back below 800K last week, initial jobless claims have taken a pause coming in at 787K for the week ending January 1st. That was unchanged from the previous week’s original reading, though, that number was revised up to 790K this week. While claims were little changed and remain off the low of 711K from early November, this week’s 3K decline was better than the forecasted uptick back up to 800K.

It is a bit less positive of a picture for unadjusted claims. After three weeks of declines, claims rose by 77.4K this week up to 922.1K. While at least part of that increase was a result of seasonality, that was the highest reading since the week of December 11th when claims came in at 941.9K.

Although regular state claims on an unadjusted basis were higher, total claims with the inclusion of the Pandemic Unemployment Assistance (PUA) program saw an improvement. Total claims between the two programs fell to 1.084 million from 1.155 million last week. That decline was driven by a big drop of about 48% WoW in PUA claims which came in at a new low of just 161.46K. The 149K decline in PUA claims was the largest since the first week of August when claims under this program dropped 166.36K. While that may sound like a positive, as detailed below, it should be taken with a grain of salt.
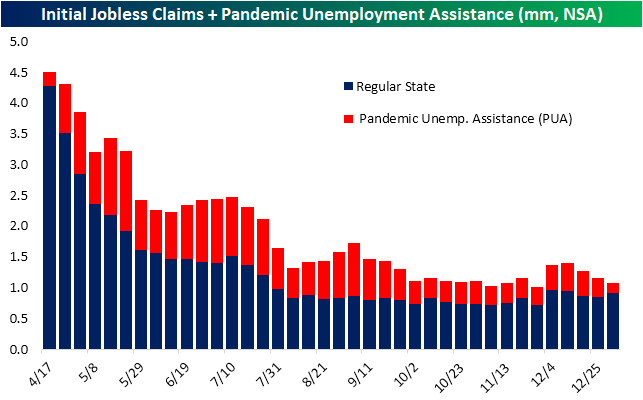
While that large drop in PUA claims is possible, there were irregularities on a state-by-state basis meaning the big drop was more likely due to a combination of the timing of when the recent spending bill was signed and the holidays. For instance, some states like Ohio, Florida, and Indiana reported zero PUA claims in the most recent week despite counts in the tens of thousands the prior week. Other states like Illinois and Kentucky may not have reported zero claims, but they reported single to double-digit numbers despite counts that were materially higher in the prior week.

As for continuing claims which are lagged one week to initial jobless claims, claims fell 126K for their fourth consecutive weekly decline. That leaves claims just above 5 million which is the lowest level since the week of March 20th.

Including the most recent data for all other programs in addition to regular state claims adds another week’s lag. That means the most recent print is for the week of December 18th. Total claims across all programs came in at 19.2 million, down from 19.6 million the week before. That is still above the pandemic low of 19.077 million from November 20th but marks a third consecutive improvement. The declines were broad across programs with the only uptick coming from the Extended Benefits program. Given this, the trend of a growing number of those on some sort of extension has continued with the Extended Benefits program accounting for a new high of 5% of all claims. Claims for all extension type programs accounted for roughly 29% of all continuing claims in the most recent week’s data. Click here to view Bespoke’s premium membership options for our best research available.

Asset Class Performance to Start 2021
Large-cap Tech led the US equity market in 2020, but it has gotten off to a rough start to 2021. As shown in our asset class performance matrix below, the Nasdaq 100 (QQQ) is down 1.98% YTD after gaining 48.62% in 2020. The S&P 500 (SPY) is down 0.09%, while the Dow 30 (DIA) is up 0.79%.
While large-cap index ETFs are flat to down so far this year, the small-cap ETFs like IJR and IWM are up 6% and 4.3%, respectively. The S&P 500 Growth ETF (IVW) is down 1.77% to start the year, while the S&P 500 Value ETF (IVE) is up 1.6%. Small-cap value (IJS) is already up 6.8% on the year. The DJ Dividend ETF (DVY) is up 3.6% so far in 2021 after falling 4.9% in 2020. 2021 has so far been the opposite of 2020 in terms of what’s outperforming.
Looking at S&P 500 sectors, the Energy sector (XLE) is up 7.8% YTD after falling 32.5% in 2020. Materials (XLB) and Financials (XLF) have gotten off to a hot start to the year as well. On the flip side, we’ve seen Technology (XLK), Consumer Staples (XLP), and Communication Services (XLC) fall more than 1%.
Outside of the US, international equity markets have staged nice rallies over the first three trading days of the year. The UK (EWU) is already up 6% while China (ASHR) is up 5%. The only country ETF in the matrix that is down is Brazil (EWZ) with a decline of 1.2%.
Commodity ETFs are up across the board, with DBC up 2.4%, oil (USO) up 3.3%, natural gas (UNG) up 6.9%, silver (SLV) up 3.1%, and gold (GLD) up 0.9%. Treasury ETFs have seen some of the weakest performance numbers to start 2021 with the 20+ Year Treasury ETF (TLT) already down 2.9%. Click here to view Bespoke’s premium membership options for our best analysis available.

Bespoke’s Morning Lineup – 1/7/21- Regrouping
See what’s driving market performance around the world in today’s Morning Lineup. Bespoke’s Morning Lineup is the best way to start your trading day. Read it now by starting a two-week free trial to Bespoke Premium. CLICK HERE to learn more and start your free trial.
“The truth does not change according to our ability to stomach it.” – Flannery O’Connor
They’re trying to pick up the pieces in Washington DC today after Congress certified the results of the November election very early this morning. Futures are up and indicated to open at more record highs. In economic news, both initial and continuing jobless claims came in lower than expected. Regarding the Fed, there are a number of speakers on the calendar today, so those comments will be watched closely.
As we often say, markets are usually better off when Washington isn’t the story, so hopefully, there is no breaking news on that front going forward in the days ahead.
Be sure to check out today’s Morning Lineup for updates on the latest market news and events, the results of the electoral college certification, economic data out of Europe, an update on the latest national and international COVID trends, and much more.

The rally in bitcoin just won’t stop. While a normal price chart of the crypto-currency looks crazy enough, looking at bitcoin’s ascent in terms of its price relative to gold is even crazier. After today’s 8% rally, one bitcoin is now worth a pound and a quarter of gold. On Election Day, one bitcoin was worth a half-pound of gold, which at the time we thought was a lot. At the end of the year, though, the ratio moved to a pound, and year to date, bitcoin’s price has rallied more than 30%- in less than a week!

While the move in bitcoin has been extreme on a percentage basis, it may sound hard to believe, but the current move is not even as large as other similar moves in recent years. Over the last 50-days, bitcoin’s price has rallied more than 115%, but back in June 2019, its price rallied more than 138% over 50-days, and back in late 2017, the price rallied more than 300%!

Daily Sector Snapshot — 1/6/21
Quality Dividends Showing Strength
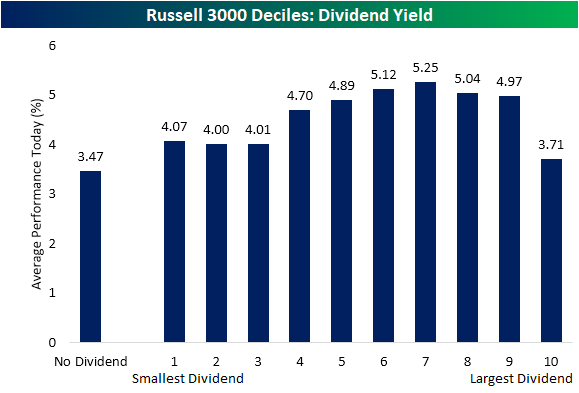
Dividend stocks are having a great day with the iShares Select Dividend ETF (DVY) up over 4% as of this writing. That is the best day for dividend stocks since early November and is nearly 3 percentage points of outperformance relative to the S&P 500 (SPY). Looking at Russell 3000 stocks based on the constituents’ dividend yields, stocks that do not pay any dividends, which there are over 1600 of, are up by an average of 3.47% today compared to an average gain of 4.58% for all stocks in the index that do pay a dividend. Breaking up those stocks that pay dividends into equal-sized deciles, generally, those stocks with higher yields are performing better. Granted, the 10th decile which is comprised of stocks with the highest yields have actually underperformed other dividend payers with an average gain of just 3.71%. That compares to deciles six through nine which have all risen around 5% on average. Although worse than other stocks that pay dividends, the performance of the 10th decile is still better than those stocks without a payout.
Taking a look at performance based on dividend growth over the past year, the stocks that have seen their payouts lowered from last year are actually up the most today. On the other hand, companies with higher dividends are underperforming with an average gain of just 4.36%. Again, while that is underperformance relative to other dividend payers, it is still stronger returns than those stocks with no payouts. Meanwhile, companies that have not changed their payout have seen more middling performance.

Investors also do not appear to be chasing just any yield. When a stock has a high payout ratio, it is typically viewed as being less likely to be able to maintain its dividend. Today, those stocks with the highest payout ratios have seen weaker gains. For example, the ninth decile actually is averaging weaker performance than non-dividend paying stocks. Comparatively, deciles three through six which are comprised of those with healthy payout ratios ranging between the low teens to low 40’s are all up over 5% on average. The bottom two deciles made up of the lowest payout ratios have seen slightly weaker returns, but those are also still stronger than those with the highest payout ratios. Click here to view Bespoke’s premium membership options for our best analysis available.

Bespoke Consumer Pulse Report — January 2021
Bespoke’s Consumer Pulse Report is an analysis of a huge consumer survey that we run each month. Our goal with this survey is to track trends across the economic and financial landscape in the US. Using the results from our proprietary monthly survey, we dissect and analyze all of the data and publish the Consumer Pulse Report, which we sell access to on a subscription basis. Sign up for a 30-day free trial to our Bespoke Consumer Pulse subscription service. With a trial, you’ll get coverage of consumer electronics, social media, streaming media, retail, autos, and much more. The report also has numerous proprietary US economic data points that are extremely timely and useful for investors.
We’ve just released our most recent monthly report to Pulse subscribers, and it’s definitely worth the read if you’re curious about the health of the consumer in the current market environment. Start a 30-day free trial for a full breakdown of all of our proprietary Pulse economic indicators.

Massive Outperformance From Renewables and Banks
With the Democratic party looking to pick up two more seats in the Senate, investors are flocking to names that would benefit from the party’s agenda; namely renewable energy stocks. While valuations in the renewables space have already been stretched in the past year as we noted in last night’s Closer, today the multiple expansion has only accelerated as these names are having a banner day. The Invesco Solar ETF (TAN) as well as the Invesco WilderHill Clean Energy ETF (PBW) are up around double-digit percentages or more in today’s session and are on pace for the best day since March 24th of last year- the first day of the current bull run.
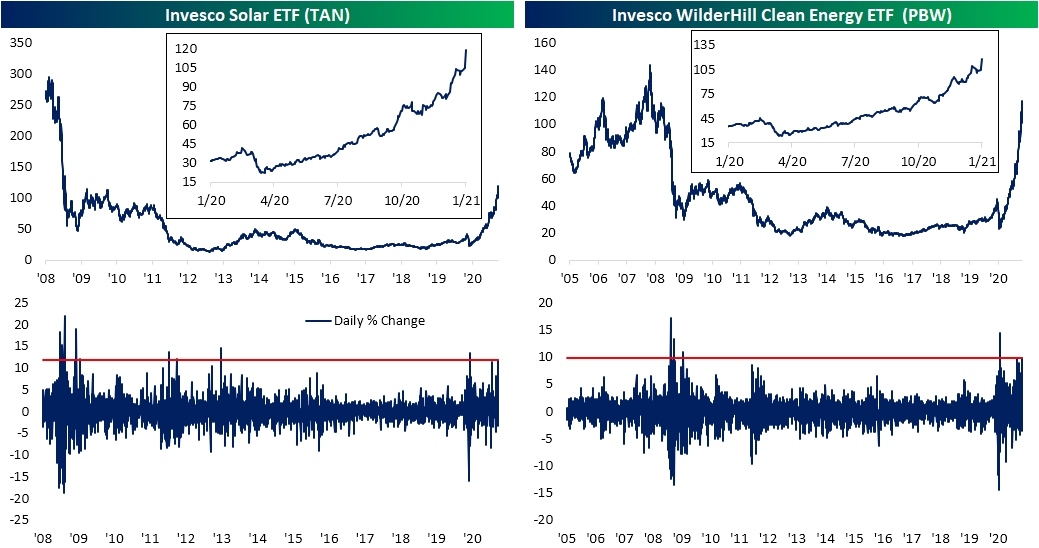
Relative to the broader market, today’s performance is even more spectacular. In the charts below, we show the ratio of TAN and PBW relative to the S&P 500. For TAN, the move higher in the ratio today surpasses any day of the past year. In fact, the 10.39% rise in the ratio today is on pace to be the largest single-day increase since April of 2013. For PBW, the increase in the ratio is second only to March 26th of 2009.

Another area of huge outperformance today is the banks. The 10-year yield has topped 1% for the first time since March. With yields providing a more welcoming environment for the industry, the S&P Regional Banking ETF (KRE) is up 8.5%. That is the best day since November 9th when the ETF popped over 15%. While nearly half of that day’s rally, KRE’s performance today still stands in the top 1% of all days since it began trading in 2006.

Again, just like the renewable energy ETFs, the strong performance of banks relative to the broader market is historic today. Prior to today, the ratio of KRE to SPY has only seen a larger daily increase five times since 2006. One of those days was the aforementioned rally in November with the other days occurring in July and September of 2008 and March of 2009. Click here to view Bespoke’s premium membership options for our best research available.

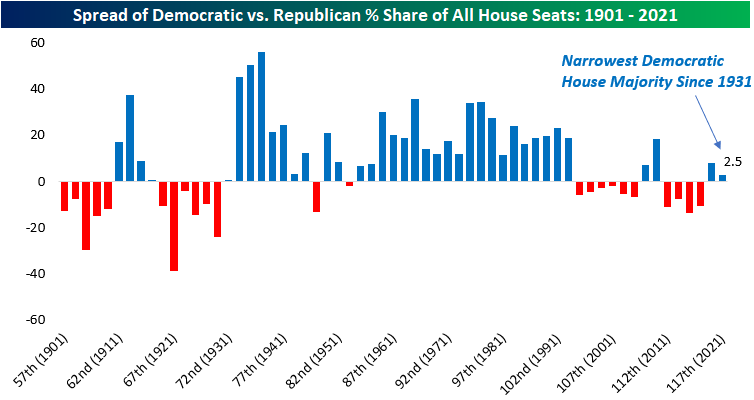
Chart of the Day: Slim Democratic Control
With the results from the Georgia run-off elections for the US Senate now mostly in, it looks all but official that the Democratic Party will essentially have control of the Presidency, the Senate, and the House. As we noted in the Washington section of our annual outlook, “While individual laws or legislative proposals can, and often do, impact individual companies, the impact of DC on financial markets is over-rated.” With that caveat in mind, in today’s Chart of the Day, we provided an analysis of market returns when the Democratic Party had full control in DC. To read the full report, sign up for a free trial to one of Bespoke’s research offerings.
One notable aspect of the upcoming session of Congress, however, is how narrow the Democratic Majority will be in both houses of Congress. In the Senate, the majority will come down to a tiebreaking vote, while in the house, their majority will only amount to 2.5% of all House seats. As shown in the chart below, that will be the narrowest Democratic majority in the House since 1931! While Democrats will likely have full control in DC in the 117th session of Congress, it’s hard to remember a time when the divide was so close down the middle as it is now.