Daily Sector Snapshot — 1/8/21
December 2020 Headlines
Cyclicals Climb, Defensives Decline
As we noted in yesterday’s Sector Snapshot, cyclical sectors are leading the way higher in 2021 as Energy, Materials, and Financials are all up around 5% or more compared to the S&P 500’s gain of a more modest 1.65% YTD. That outperformance has led to some sharp moves in the relative strength lines of several sectors. As shown below, the Materials sector and Financials have both seen sharp moves higher in their relative strength lines versus the S&P 500. For Materials, this has been part of a broader trend of outperformance (upward trending line) that has been in place over the past year. For Financials, prior to this most recent upswing, the line first began to trend higher in the late Fall but then took some pause in December. Meanwhile, Consumer Discretionary, Energy, Health Care, and Industrials have also made moves higher, albeit more modest than those of Materials and Financials.
As for the other sectors’ relative strength lines, there have been some sharp moves in the opposite direction. Starting with what had been market leaders at various points of the past year, Communication Services and Technology are perhaps some of the most notable negative reversals. For the former, the relative strength line has generally moved sideways over the past year, but since mid-December, the line has been on the decline with one of the most dramatic legs lower taking place in the past week. Tech was a consistent outperformer in the first half of 2020, but since the summer that outperformance has faltered. The sector’s relative strength line peaked and has been trending sideways since the start of September and the move so far in 2021 has brought the line down towards the low end of the past few months’ range. As for other sectors, Real Estate, Utilities, and Consumer Staples have been trending lower for the better portion of the past year, but with cyclical sectors flying, the relative strength lines of these more defensive sectors have made new lows this week in dramatic fashion. Click here to view Bespoke’s premium membership options for our best research available.

Sector Breadth Strong
Several measures of market breadth have been showing strength recently as we noted in yesterday’s Sector Snapshot. Over 80% of S&P 500 stocks trade above their 50-DMAs, more than half are overbought (at least two standard deviations above its 50-DMA), and over 20% of S&P 500 stocks reached new 52-week highs yesterday. Additionally, shorter-term breadth as measured by the 10-day advance-decline line has also been strong. Pretty much across the board, every sector’s 10-day A/D line has tipped into overbought levels. That doesn’t apply to only Consumer Staples and Real Estate which have more modest readings, though breadth for these sectors has still been positive recently. At the moment, Materials, Health Care, and Financials are the most overbought sectors by this measure. Overall, the sharp moves higher in the 10-day A/D lines does flash a warning sign for the very near term that things are running a bit hot.

As previously mentioned, several sectors are reaching new 52-week highs, and given breadth has been strong to match, cumulative advance-decline lines are confirming the moves higher. As shown in the charts below, Consumer Discretionary, Health Care, Industrials, Materials, as well as the broader S&P 500 all closed at 52-week highs last week and so too did those sectors’ cumulative A/D lines. While price did not close at new highs, Tech, Financials, and Communication Services also all saw new highs in their cumulative AD lines. Click here to view Bespoke’s premium membership options for our best research available.

Stocks Off to Strong Start to 2021
The average stock in the Russell 3,000 is already up 5.24% year-to-date after just four trading days. And to think, major indices were down ~1% on the first trading day of the year this past Monday. Below we highlight the average YTD performance of stocks by sector in the Russell 3,000. Remember, the Russell 3,000 contains large-caps, mid-caps, and small-caps, and it covers roughly 98.5% of all US-traded market cap. As shown, Energy stocks have jumped out to the strongest start to the year with an average gain of 13.26%. Materials rank second with a gain of 9.1%, and then Industrials, Financials, Health Care, and Consumer Discretionary are all bunched together with gains between 5% and 6%. Technology stocks — last year’s big leaders — are ‘only’ up 4.34% on average so far in 2021, while the Real Estate sector is the only one that has averaged declines. Click here to view Bespoke’s premium membership options for our best research available.

Looking at Industry Groups, while Technology as a whole is underperforming a bit, the Semiconductor group (which are part of the Tech sector) is up big with average YTD gains of 9.4%. Autos are also performing very well with a gain of 9.2%. Thank you Tesla (TSLA).

There are already more than 600 stocks in the Russell 3,000 that are up more than 10% year-to-date. That represents 20% of the index.
Below is a look at the top-performing stocks so far in 2021. Usually, it takes weeks or months to see YTD gains like these, but we’ve gotten here in just four trading days. 3D Systems (DDD) ranks first with a gain of 119%, followed by Atomera (ATOM) at 70%, ViewRay (VRAY) at 59.5%, Arcturus (ARCT) at 54%, and Akerna (KERN) at 52%. We don’t fault you if you have never heard of these names!

Bespoke’s Morning Lineup – 1/8/21 – Jobs Friday
See what’s driving market performance around the world in today’s Morning Lineup. Bespoke’s Morning Lineup is the best way to start your trading day. Read it now by starting a two-week free trial to Bespoke Premium. CLICK HERE to learn more and start your free trial.
“Even the intelligent investor is likely to need considerable willpower to keep from following the crowd.” – Benjamin Graham
It’s ‘jobs Friday’ and for once it seems that it isn’t ‘the most important jobs report of the year’. What makes that even more impressive is that so far, it’s the first report released in 2021! Right now, the market either has other things to worry about or simply doesn’t’ care. It’s hard to tell.
In markets, futures are higher again today as equities have rallied around the world, especially in Asia. Treasury yields are slightly higher in the US, while the dollar is slightly lower.
Be sure to check out today’s Morning Lineup for updates on the latest market news and events, a recap of economic data out of Europe, an update on the latest national and international COVID trends, and much more.

The year is only four trading days old, but already we’ve seen some big moves. While it may seem like we’re an environment where everything is going up, five of the S&P 500’s eleven sectors are actually down on the year with defensives like Consumer Staples, Utilities, and Real Estate all down 1.5% or more. On the upside, the S&P 500 and six other sectors are up over 1%, but the real strength has been in Energy, Materials, and Financials. Energy’s 9.4% gain has been the most impressive of any sector, though. If the year ended today, it would be the best year for Energy since 2016!

The Bespoke 50 Top Growth Stocks — 1/7/21
Every Thursday, Bespoke publishes its “Bespoke 50” list of top growth stocks in the Russell 3,000. Our “Bespoke 50” portfolio is made up of the 50 stocks that fit a proprietary growth screen that we created a number of years ago. Since inception in early 2012, the “Bespoke 50” is up 438.5% excluding dividends, commissions, or fees. Over the same period, the S&P 500 is up in price by 175.3%. Always remember, though, that past performance is no guarantee of future returns. To view our “Bespoke 50” list of top growth stocks, please start a two-week free trial to either Bespoke Premium or Bespoke Institutional.

Bespoke’s Weekly Sector Snapshot — 1/7/21
Optimism Pulling Back
Although the S&P 500 has returned to record highs today, the drawdown that had been in place for most of the week did manage to put a dent in sentiment. In the AAII’s weekly survey, just 42.13% of respondents reported as bullish. That is down from just over 46% last week and is the lowest level in bullish sentiment since the first week of November. Granted, that is still an elevated reading relative to the past several years. In fact, it is nearly 10 percentage points above the average reading of bullish sentiment of the past five years.

With the decline in bullish sentiment, bearish sentiment picked up. Bearish sentiment rose 6.7 percentage points up to 33.5%. That is the highest reading of bearish sentiment since the final week of October. Unlike bullish sentiment though, that is much more in line with the average sentiment reading of the past several years. Over the past five years, bearish sentiment has averaged 32.5%, roughly one percentage point away from the current reading.

Given the inverse moves of bullish and bearish sentiment, the bull-bear spread has come back down to more moderate levels. At 8.63, it is at the lowest level since the first week of November. Granted, those reporting as bullish continue to outnumber those reporting as bearish.

Not all of the gains to bearish sentiment came from the bullish camp. The percentage of investors reporting a neutral outlook on the market fell for a second week in a row dropping to 24.37%. Neutral sentiment has fallen just over 10 percentage points over the past two weeks, the biggest two-week decline since the two week period ending November 12th. Click here to view Bespoke’s premium membership options for our best research available.

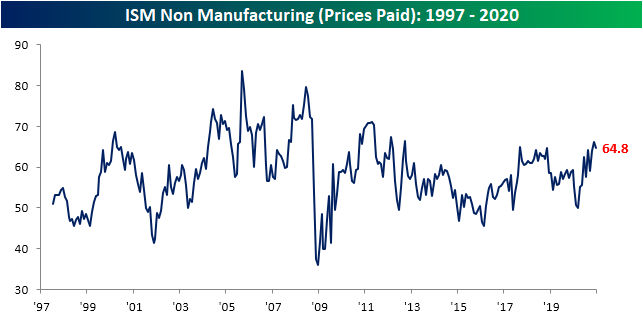
No Price Declines Yet Again
As we noted on Tuesday (see here and here), the ISM’s report on the manufacturing sector showed a significant acceleration in price increases in December. Today’s release of the non-manufacturing report similarly showed prices paid have continued to rise, albeit at a slower pace as the index fell to 64.8 from 66.1 in November. Granted, the rate of price increases remains at one of the highest levels of the past decade.
One other notable similarity between the two reports was the price changes for commodities. As we noted on Tuesday, prices for freight, steel products, and some PPE materials were all observed as moving higher. That was also the case for the service sector. Taking a closer look, though, a wider variety of PPE products are in short supply, and as a result, are moving higher in price than was shown in the manufacturing report. More specifically, only gloves were noted as moving higher in price in the manufacturing report, but the services report saw higher prices in not only gloves but also gowns and masks. Additionally, and perhaps one of the most interesting aspects of the report for the Services sector was that just like Tuesday’s release there was not a single commodity reported as falling in price. Click here to view Bespoke’s premium membership options for our best research available.
