More Jobless Claims Improvements
There was a lot to like in this morning’s jobless claims release. For starters, claims beat expectations falling to 779K rather than the forecasted decline to only 830K. Additionally, last week’s number was revised down by 35K to 812K compared to the original 847K number. This week, claims fell for a third week in a row with the 33K decline bringing the total drop to 148K over the past three weeks since the high of 927K. While there is still plenty of room for further improvement given claims remain well above the pre-pandemic record high of 695K, at 779K claims are now at the lowest level since the last week of November’s level of 716K which was also the second-lowest reading of the pandemic behind November 6th’s 711K print.

On a non-seasonally adjusted basis, claims have also dropped sequentially for three weeks in a row. Unadjusted claims have now fallen by nearly 300K since the high of 1.113 million in the second week of the year. Now at 816.2K, non-adjusted claims are at the lowest level since the last week of November. As we have noted the past couple of weeks, falling claims are normal for this time of year with last week (the fourth week of the year) and the previous week (the third of the year) historically having seen claims lower week over week 90.74% and 100%, respectively, of the time all years since 1967. Turning to the current week of the year, there is not as consistent of a trend as the past couple of weeks, but historically claims have moved lower more often than not.

Even including PUA claims, total initial jobless claims dropped this week. Alongside the 23.535K decline in regular state claims, PUA claims fell by 54.68K. In total, this week saw 1.165 million claims between the two programs, down from 1.243 last week marking a continued return towards the low of just above 1 million at the end of October.

As for continuing claims which are lagged an additional week to initial claims, the declines keep coming. Continuing claims totaled 4.592 million this week, down 193K from the prior week’s upwardly revised reading. Like initial jobless claims, that was better than the expected reading of 4.7 million and also set a new low for the pandemic.

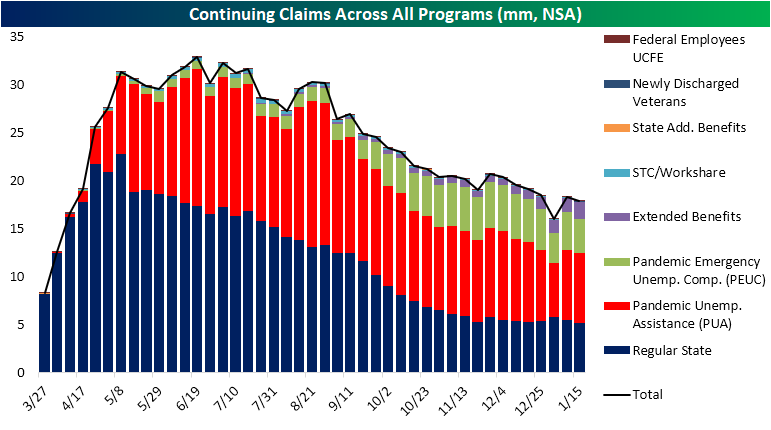
Including all programs adds another week’s lag but for the week of January 15th, total claims across all programs declined to 17.87 million from the prior week’s spike higher to 18.359. Most programs contributed to that decline with the biggest contribution coming from the Pandemic Emergency Unemployment Compensation (PEUC) program which saw claims fall by 289.91K. Outside of the first week of the year when this program fell by over 1 million (likely due to benefits expiration at the end of 2020 and other discrepancies as a result of the timing of the spending bill) that 289.91K decline was the largest week over week drop on record. Despite that decline, a 197K uptick in the Extended Benefits program made for a new high in the extension programs’ share of total claims. Click here to view Bespoke’s premium membership options for our best research available.

Bespoke’s Morning Lineup – 2/4/21 – That’s a Negative
See what’s driving market performance around the world in today’s Morning Lineup. Bespoke’s Morning Lineup is the best way to start your trading day. Read it now by starting a two-week free trial to Bespoke Premium. CLICK HERE to learn more and start your free trial.
“An investor without investment objectives is like a traveler without a destination.” – Ralph Seger
There’s not a whole lot going in in the markets this morning…yet. While futures are indicated just modestly positive, there’s a bunch of economic data on the calendar starting with jobless claims (779K vs 830K, lowest since November), unit labor costs (6.8% vs 4.0%), and productivity (-4.8% vs -3.0%) all just hitting the wires. One interesting item of news out of the UK was that even as the Bank of England took a large haircut to 2021 growth forecasts (from 7.25% down to 5.0%), it said it does not plan to signal that negative rates are on the way. That being said, the Bank did instruct banks to start preparing for negative rates nonetheless. How’s that for certainty?
Be sure to check out today’s Morning Lineup for updates on the latest market news and events, earnings reports from around the world, a discussion of recent moves in the all-important iron-ore market, moves in the euro, an update on the latest national and international COVID trends, and much more.

To say that the last week has been a see-saw for the market would be an understatement. Last week, the S&P 500 went from overbought levels (one standard deviation above 50-DMA) to below its 50-DMA in the span of three trading days. Just two trading days later, the S&P 500 was not only back above its 50-DMA, but it was also back at overbought levels. That may not sound like all that an extreme of a reversal, but going all the way back to the start of the S&P, there have only been 14 other periods where the S&P 500 closed below its 50-DMA after being at overbought levels within the prior three trading days and then went on to close at overbought levels within the next three trading days. Looking at the occurrences on the chart, it hasn’t been a very consistent market signal, but it does shed light on just how volatile the last several trading days have been.

Daily Sector Snapshot — 2/3/21
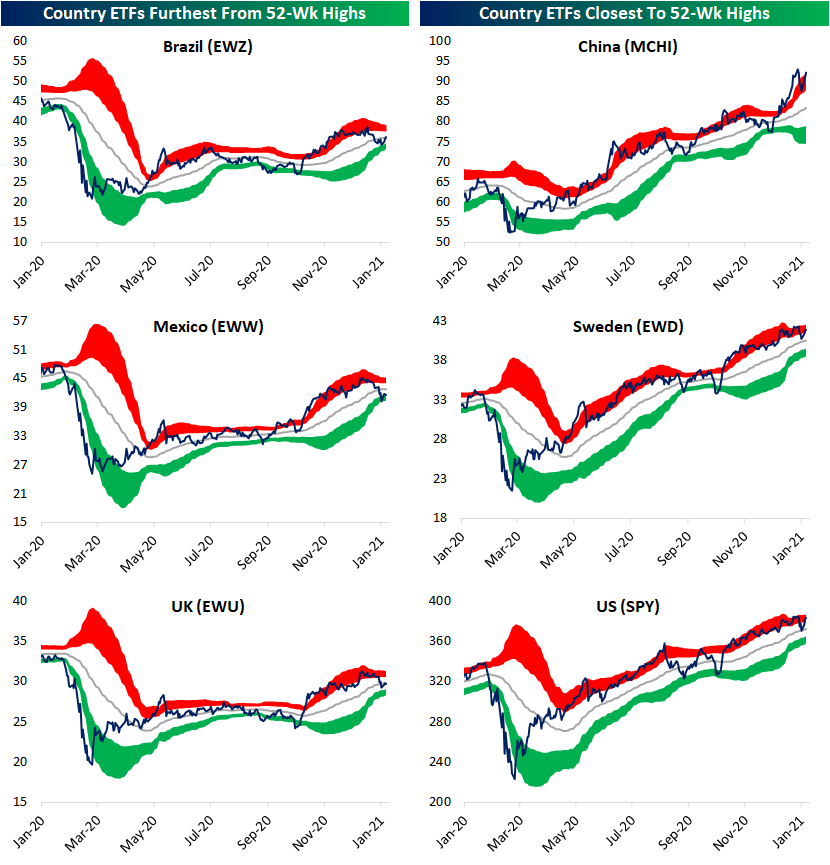
Country ETFs Closing in on New Highs
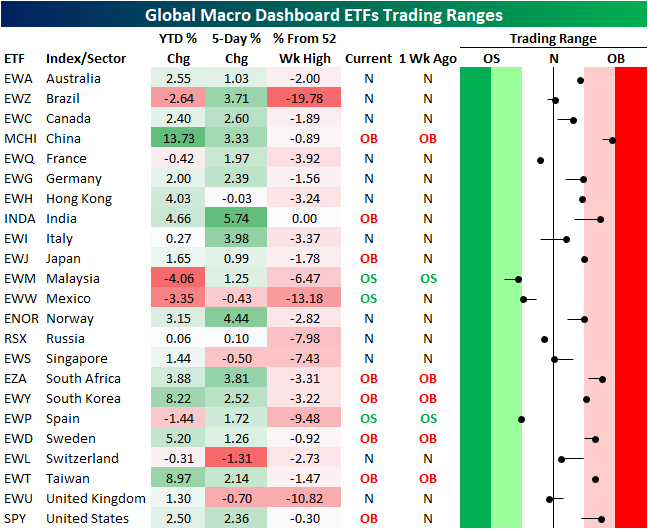
As the S&P 500 (SPY) bounces back from last week’s declines, global equities are broadly doing the same. Glancing across the rest of the countries tracked in our Global Macro Dashboard, most countries have similarly risen over the past week with only Hong Kong (EWH), Mexico (EWW), Singapore (EWS), Switzerland (EWL), and the United Kingdom (EWU) lower over the past five days. For the US, the rally over the past few days has left SPY within 1% of its 52-week/all-time high.
Like the US, there are several other country stock market ETFs that are also a few percentage points away from a new high, but only one, India (INDA), has reached a new 52 week high. China (MCHI) and Sweden (EWD), like SPY, are also within 1% of their highs. China is also the most overbought country ETF trading nearly 2 standard deviations above its 50-DMA. While none are nearly as overbought as China, there are seven other countries that are also overbought including the US. On the other hand, Brazil (EWZ), Mexico (EWW), and the UK (EWU) are all over 10% below their 52 week highs. Granted, only EWW is currently oversold alongside Malaysia (EWM) and Spain (EWP), though EWM and EWP are close to no longer being oversold. Click here to view Bespoke’s premium membership options for our best research available.
B.I.G. Tips – An Extended Alphabet
A New Act Or A Small Shift?
A couple of weeks ago in our Equity Market Pros and Cons report, we highlighted the chart below showing the S&P 500 over the past year and the various “acts” of sector rotation in those periods. Overall, the fact that various sectors have been participating at different stages of the rally has been a good sign for breadth. In the most recent act, the leaders have been sectors like Energy, Financials, and Tech which are the three top-performing sectors. On the other hand, Real Estate, Utilities, and Consumer Staples have been some of the worst-performing sectors.

But looking at the relative strength charts of the eleven sectors versus the S&P 500 over the past year, there have been some reversals recently, meaning some of the trends that have been in place over the past few months are turning a corner. For example, the relative strength lines of Energy and Financials—the two best performing sectors since November—have generally been in uptrends during the current “act” meaning they have outperformed the broader S&P 500. But in the past couple of weeks, the relative strength lines of both Energy and Financials have broken those uptrends. The Industrials sector has seen the same play out while the Materials sector is sitting right at the bottom of its multi-month uptrend.
On the other hand, Technology—which has been the third best performing sector—has seen its relative strength line make a break higher alongside Communication Services. While a less recent development, Consumer Discretionary has also seen its relative strength line resume its uptrend. Perhaps more interestingly, some defensive sectors like Real Estate and to a lesser degree Utilities have been the laggards of the current act, but have seen their relative strength lines turn higher recently. For the former, this recent uptick has broken the past year’s downtrend. Granted, the same trends are still very much in place for the other two defensives: Consumer Staples and Health Care. Click here to view Bespoke’s premium membership options for our best research available.

Guns A’ Blazin’
Earnings Season Selling
Our Earnings Explorer tool allows users to track every single earnings report throughout earnings season to find individual stock opportunities or identify broader macro trends through our summary analysis. The tool contains data on more than 155,000 individual quarterly earnings reports from stocks dating back to 2002! There are countless ways for a user to filter and analyze the data to find what they’re looking for. It’s a must-try product that you can access with a two-week free trial to Bespoke Institutional.
Using our Earnings Explorer, we found that 417 companies had reported earnings since the current reporting period began on January 11th. As shown in the snapshot from the tool below, 84% of these companies beat bottom-line analyst EPS estimates, while 77% beat top-line sales estimates. In terms of guidance, 14% of companies have raised forward guidance while just 2% have lowered guidance.
What has been notable about this earnings season is the price action that stocks are seeing after they report their quarterly numbers. On average, stocks that have reported have gained 0.41% at their first open of trading after their earnings release. This means stocks are initially reacting positively to the earnings news. From the open to the close of trading after the initial gap higher, though, stocks that have reported have averaged a decline of 1.67%. Combining the opening gap and the open to close move, the average full one-day change for stocks reporting earnings stands at -1.28% this season. That’s a pretty bad number that’s indicative of a “sell the news” reaction.
The snapshot below also shows the stocks that have reacted the most positively to their earnings reports so far this season. Pot-stock company Aphria (APHA) has seen the best reaction of any company to report so far with a one-day gain of 21.1%. As it stands now, Netflix (NFLX) has seen the second-best reaction to earnings with its one-day gain of 16.85% on January 20th (it reported after the close on 1/19).

There have been ten stocks that have dropped more than 10% on their earnings reaction days this season, and we list them below. The three biggest losers have been software company Agilysis (AGYS), Pitney Bowes (PBI), and Harley Davidson (HOG). To use our Earnings Explorer tool and access everything else Bespoke’s research platform has to offer, start a two-week trial to Bespoke Institutional today.

B.I.G. Tips – Charts We’re Watching – 2/3/21
Bespoke’s Morning Lineup – 2/3/21 – Moving On
See what’s driving market performance around the world in today’s Morning Lineup. Bespoke’s Morning Lineup is the best way to start your trading day. Read it now by starting a two-week free trial to Bespoke Premium. CLICK HERE to learn more and start your free trial.
“I very frequently get the question: ‘What’s going to change in the next 10 years?’ And that is a very interesting question; it’s a very common one. I almost never get the question: ‘What’s not going to change in the next 10 years?’ And I submit to you that that second question is actually the more important of the two — because you can build a business strategy around the things that are stable in time. – Jeff Bezos
A strong earnings report from Amazon.com (AMZN) last night was overshadowed by the news that founder and CEO Jeff Bezos would be stepping down to take on the role of executive chairman beginning on July 1st. While the news made headlines, Bezos isn’t going anywhere; he’s only going to be less active in the day-to-day operations of the company which reports suggest he already has been for some time.
While Jeff Bezos is symbolically moving on from running the company he founded, we’ve also passed the peak of earnings season as all of the mega-caps have now reported quarterly numbers. There are still a lot of individual companies scheduled to report, but the companies representing much of the market cap for the S&P 500 have already reported. Investors will now have to find another issue to focus on, and that will likely be the progression of economic and COVID data which are both intertwined. One economic data point out this morning was the ADP Private Payrolls report which topped expectations by more than 100K (174K vs 70K).
Be sure to check out today’s Morning Lineup for updates on the latest market news and events, earnings reports from around the world, an update on Markit Services PMIs, an update on the latest national and international COVID trends, and much more.
The price of bitcoin has been consolidating in recent weeks after its surge to end 2020, but prices of ethereum have been climbing to new highs. The chart below shows the ratio of ethereum to bitcoin over the last twelve months, and ethereum’s strength has caused the ratio to breakout above its highs from the end of last summer.

From a longer-term perspective, ethereum’s rally has also taken the ratio above its highs from early 2019 as well, but still well off its record highs from early 2018. While ethereum still trades for less than one-twentieth of the price of bitcoin back in early 2018 it was as much as one-tenth of the price. In other words, even after the recent rally, ethereum’s price relative to bitcoin is close to historical lows than highs.
