Bespoke’s Morning Lineup – 2/2/21- Global Rally Continues
See what’s driving market performance around the world in today’s Morning Lineup. Bespoke’s Morning Lineup is the best way to start your trading day. Read it now by starting a two-week free trial to Bespoke Premium. CLICK HERE to learn more and start your free trial.
The stock market is a device to transfer money from the impatient to the patient.” – Warren Buffett
The global rally continued overnight as US futures are firmly in positive territory after the S&P 500 briefly tested its 50-DMA. The only area of the market not rallying are stocks (like GameStop and others) originally targeted by the Reddit traders. Silver is also down sharply on the day, erasing much of Monday’s gains.
Be sure to check out today’s Morning Lineup for updates on the latest market news and events, earnings reports from around the world, a discussion on the latest moves in the commodities markets, a recap of the latest in the COVID relief negotiations, an update on the latest national and international COVID trends, and much more.

Just as equities in the US bounced after the S&P 500 tested its 50-day moving average, European equities also bounced at two key levels of support yesterday. As shown in the chart, the rally of the last two days started just below the STOXX 600’s 50-day moving average and right at the prior highs of the consolidation range from December.

Daily Sector Snapshot — 2/1/21
Bespoke Market Calendar — February 2021
Please click the image below to view our February 2021 market calendar. This calendar includes the S&P 500’s average percentage change and average intraday chart pattern for each trading day during the upcoming month. It also includes market holidays and options expiration dates plus the dates of key economic indicator releases. Start a two-week free trial to one of Bespoke’s three research levels.

Shorting Silver
Whereas the focus of the investment world last week was on the most heavily shorted stocks, this week it has turned to the metals market as silver is having a tremendous day. In today’s Morning Lineup, we highlighted a few reasons why the squeeze in SLV is an entirely different animal than what was seen last week. Taking a further look at this, positioning this time around for silver looks quite different than it did for stocks like GME. Whereas GameStop (GME) had more shares short than exist in the market, silver positioning is actually net long. In the chart below, we show the speculator net positioning (as a percent of open interest) for silver as per Commitment of Traders data released on Friday which we also covered in Friday’s Closer. Net positioning (positive readings mean a net percentage of open interest is long and vice versa for negative readings) is in the 77th percentile of all weeks since 1986. That is also at the highest level since mid-February of last year. Prior to that, the last time speculator positioning was as long was in late November of 2017. In other words, at least for futures contracts, a retail pump of silver would be targeting a metal that speculator sentiment is already pretty positive on.

Additionally, in terms of the ETF tracking silver (SLV), short interest as a percentage of shares outstanding is by no means at any sort of extreme either. While the most recent bi-weekly data did show a sharp uptick in the first half of January, short interest as a percent of share outstanding is not at an elevated level. Pulling that data forward to today, 3.72% of shares outstanding are short. That is in the 60th percentile of all readings since 2006 when the ETF began trading. It’s also well off the peak of 11.75% in June of 2011. So again, if SLV was to be a target for a short squeeze like GME, there is not nearly the same base of shorts as we saw in GameStop (GME) and other stocks last week.

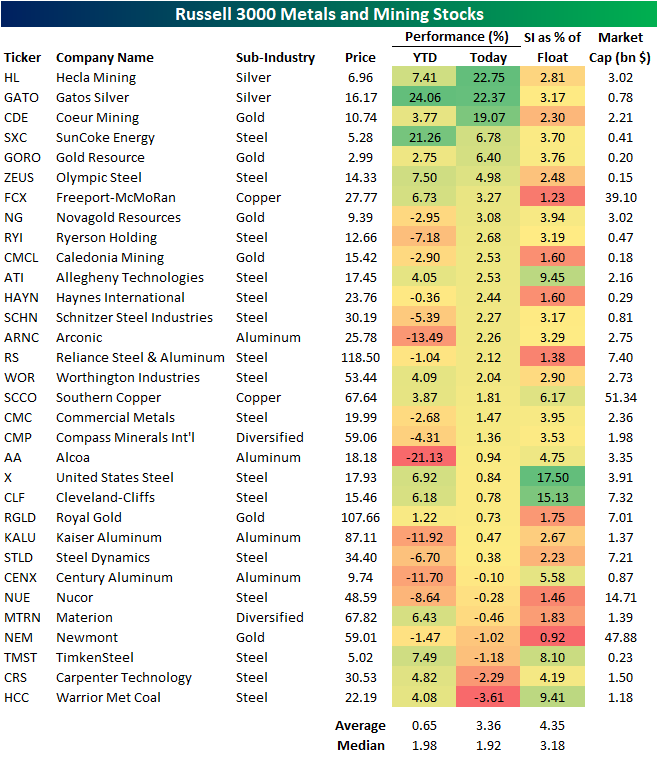
That also goes for individual mining stocks. In the table below, we show the Russell 3000 stocks that are part of the GICS Level 3 Mining and Metals industry. As shown, precious metal related names, especially those of the silver sub-industry, are flying higher today with Hecla Mining (HL) and Gatos Silver (GATO) both up over 20% as of this writing. Another silver mining giant, Coeur (CDE), is also up double digits today. Despite this, these do not have particularly high levels of short interest. In fact, steel makers like United States Steel (X), Cleveland Cliffs (CLF), and Allegheny Technologies (ATI) all boast far higher short interest as a percent of float. In other words, while silver and related stocks may be the target of retail investors this week, the “short squeeze” possibility is not the same as what was observed last week. Click here to view Bespoke’s premium membership options for our best research available.
Will Silver’s Luster Last?
Silver got off to a very strong start to February this morning as front-month futures traded up as much as 12.76% at the highs. Prices have since pulled back from those opening highs, but silver is still up around 7.5%. Another proxy for the metal, the Silver ETF (SLV) experienced a record opening gap of +11.04% this morning; the first time ever it gapped up more than 10%. The next largest gap up on record was a 7.76% gap in October of 2008. As shown in the charts below, front-month futures (based on settlement price) are now at their highest level since August 10th of last year, although earlier today it was even higher at its best level since 2013. Even after having pulled back intraday, silver futures are still on track to see a single day move in the top 1% of all days since 1975.

As of this writing, silver is up 7.4% on the day. In the table below, we show the past times since 1975 that silver was up at least 7% in a single day without another occurrence in the prior six months. The last such move was the equity market bottom of the bear market last year. Prior to that, you would have to go back to 2014 to find another time that silver experienced that large of a move. Across these past instances, performance has held a negative bias. Over the following weeks and months, median returns have been negative and silver has been higher less than half the time.Click here to view Bespoke’s premium membership options for our best research available.

Chart of the Day – No Cushion From Treasuries
Bespoke’s Morning Lineup – 2/1/21 – Global Rally
See what’s driving market performance around the world in today’s Morning Lineup. Bespoke’s Morning Lineup is the best way to start your trading day. Read it now by starting a two-week free trial to Bespoke Premium. CLICK HERE to learn more and start your free trial.
“Short cuts make long delays.“ – J.R.R. Tolkien
When futures opened for trading last night, it was looking like January’s end of month weakness was going to continue right into the start of February. After the opening weakness, dip buyers stepped up in full force turning a weak start to the month into a strong one. Across the globe, equities are rallying, and strangely enough, GameStop (GME) shares are basically flat on the day!
Economic data is relatively quiet this morning with ISM Manufacturing and Construction Spending at 10 AM eastern. Both reports are expected to show a modest decline from last month’s pace of growth but are still expected to be positive.
We’d also be remiss not to mention the spike in silver this morning as Reddit traders are moving on from equities that investors have always loved to hate to silver – one of the least respected of the precious metals. In early trading, silver is up over 10% to its highest levels since 2013.
Be sure to check out today’s Morning Lineup for updates on the latest market news and events, earnings reports from around the world, economic data out of Europe, an update on the latest national and international COVID trends, and much more.
After a weak close to January, the S&P 500 ended at its lows of the month on Friday. That decline was also notable for the fact that it was the first time since the Election that the S&P 500 closed below its 50-day moving average and ended a streak of 58 straight trading days above that level.

At 58 trading days, the most recent streak of closes above the 50-DMA for the S&P 500 was a relatively long one but nothing extreme by historical standards. In the last 10 years alone, there have been 12 streaks of longer duration including the 102 trading day streak coming out of the COVID lows. In other words, while the S&P 500’s post-election rally has ended, it doesn’t necessarily mean the market is in for an extended period of market weakness either. Without pullbacks, there wouldn’t be rallies.

B.I.G. Tips – Lay of the Land
After trading up as much as 3% YTD last Tuesday morning, the final four trading days of the month erased all of those gains and then some. By the time the closing bell rang on the first month of 2021, the S&P 500 was down a little over 1% for the year and traded below its 50-day moving average for the first time since November 3rd.
Based on the month of January, if you were looking for a return to more normalcy in 2021 compared to 2020, don’t hold your breath.
With the first month of 2021 behind us, in our latest B.I.G. Tips report, we provided a broad overview of the market’s technical picture looking at the charts of all 60 S&P 500 Industry Groups. This review provides a good summary of which groups and sectors are leading and lagging the market as the S&P 500 post-election rally starts to consolidate.

For access to our latest report, make sure you sign up for a monthly Bespoke Premium membership now!
Bespoke Brunch Reads: 1/31/21
Welcome to Bespoke Brunch Reads — a linkfest of the favorite things we read over the past week. The links are mostly market related, but there are some other interesting subjects covered as well. We hope you enjoy the food for thought as a supplement to the research we provide you during the week.
While you’re here, join Bespoke Premium with a 30-day free trial!
Short Squeezes
The Piggly Wiggly Squeeze by Nick Maggiulli (Threader)
Today, iconic Southern grocery store Piggly Wiggly (a pioneer in the modern self-serve model) is privately held, but back in the Roaring Twenties it was the subject of a monster squeeze. [Link]
Hedge funds lose $30 billion on VW infinity squeeze (Mox Reports)
At the height of the financial crisis, Volkswagen was the subject of one of the largest short squeezes in the history of the financial markets thanks to some very impressive financial machinations by Porsche. [Link]
Legal Troubles
DoorDash Can’t Duck Restaurant’s False Advertising Suit by Nicholas Iovino (Courthouse News Service)
Delivery company DoorDash was dealt a blow this week by a federal judge who allowed a class action suit by restaurants to move forward. The suit alleges that the company set up pages for restaurants on its platform which labeled them closed or unavailable when they refused to partner. [Link]
Apollo CEO Leon Black to Step Down Following Review of Jeffrey Epstein Ties by Miriam Gottfried (WSJ)
The CEO of Apollo Global Management is resigning after an investigation into his relationship with deceased former financier and alleged sex trafficker Jeffrey Epstein showed 9 figure payments for “tax advice”. [Link; paywall]
Crypto
Ray Dalio calls bitcoin ‘one hell of an invention,’ considers it for new funds by Erik Schatzker (BNN Bloomberg)
The man behind the biggest hedge fund in the world has lots of technical praise for Bitcoin and is considering investing in crypto going forward. [Link]
Harvard, Yale, Brown Endowments Have Been Buying Bitcoin for at Least a Year: Sources by Ian Allison (Coindesk)
University endowments have been buying crypto on exchanges, with purchases dating back roughly 18 months, with a source estimating “some pretty nice chunks of return”. [Link]
MicroStrategy and Bitcoin: the Mother of All Fat Tails? by Bill Miller (Miller Value)
Crypto charts have gotten parabolic enough that income-focused value investors are busily racking up positions in convertible bonds in order to get exposure. [Link]
COVID
A Chick-fil-A manager stepped in to save a South Carolina drive-thru COVID-19 vaccination clinic by Mary Meisenzahl (Business Insider)
Chick-fil-a does a huge multiple of competitors’ weekly revenues per location despite being open one less day, and a key to its success is the performance of its drive-throughs. So it’s not a shock that the experience of running one is paying off at COVID vaccination sites. [Link]
Mortality Rates From COVID-19 Are Lower In Unionized Nursing Homes by Adam Dean, Atheendar Venkataramani, and Simeon Kimmel (HealthAffairs)
Union protections that insured PPE access for nursing home workers helped to prevent spread of the virus around homes and therefore limited mortality rates. [Link]
Bubbles
If It Looks Like a Bubble and Swims Like a Bubble… by James Mackintosh (WSJ)
A list of attributes which make the recent equity market bubble (especially its most frothy sections) pretty hard to deny. [Link; paywall]
It’s not just GameStop. Market bubble fears are rising by Matt Egan (CNN)
Another review of how the current equity market environment looks in real time like the kind of situation that was after-the-fact clearly a bubble in the past. [Link]
GameStop
Steve Cohen’s Point72 Loses 10-15% Amid Month’s Hedge Fund Carnage by Katherine Burton (Bloomberg)
The carnage for short sellers this week spread to Point72, which helped deliver more capital for besieged short sellers Melvin Capital and also booked double-digit losses. [Link]
Famed GameStop bull ‘Roaring Kitty’ is a Massachusetts financial advisor by Chris Prentice and Pete Schroeder (Reuters)
The Reddit trader that has ridden GME to profits in the tens of millions is a financial advisor who was recently employed by insurance giant MassMutual. [Link]
Innovation
Parkinson’s Meds Are Hard To Grab. So TikTok Users Crowdsourced A Solution. by Kait Sanchez (The Verge)
An online community came together to support Parkinsons sufferers with an innovative design for pill bottles which can be very difficult to navigate. [Link]
Ecology
Shark Populations Are Crashing, With a ‘Very Small Window’ to Avert Disaster by Catrin Einhorn (NYT)
Human fishing has led to a catastrophic plunge in shark populations around the world, with existing protections inadequate to protect species which have been navigating the deep for hundreds of millions of years. [Link; soft paywall]
Read Bespoke’s most actionable market research by joining Bespoke Premium today! Get started here.
Have a great weekend!
The Bespoke Report – 1/29/21 – “Power to the Players”
This week’s Bespoke Report newsletter is now available for subscribers. Here’s the intro:
Just when you thought you saw it all, along comes the saga of GameStop (GME). The stock’s rally, which actually has been going on for months but really went into orbit in the last few weeks, seems to make no fundamental sense. GME is basically the Blockbuster of video games. It sells physical versions of video games that most players are now buying digitally or streaming. None of this was news to anyone paying attention, and the stock had been a favorite of the short-selling community for years. If you were just coming to the eureka moment that the GME business model faced structural headwinds, you probably shouldn’t be in the investment business.
With such a stiff secular headwind howling in its face, GME’s surge has been completely written off as market manipulation and a concerted effort by the reddit community to take out the short-sellers. And when you see charts like this, it’s not fundamentals driving the stock. The trading in GME was originally written off as a bunch of ‘video-game playing yahoos’ on message boards blindly following each other, but in the story of GME that has emerged, there was a method to the madness. Fitting to GameStop’s motto, it was a “Power to the Players” moment, where we were reminded of the quote, “Within every lie, there is usually a hint of truth, and within every truth, there is always a hint of a lie.”
To read this week’s full newsletter and access everything else Bespoke’s research platform has to offer, start a two-week trial to one of our three membership levels.


