A New Act Or A Small Shift?
A couple of weeks ago in our Equity Market Pros and Cons report, we highlighted the chart below showing the S&P 500 over the past year and the various “acts” of sector rotation in those periods. Overall, the fact that various sectors have been participating at different stages of the rally has been a good sign for breadth. In the most recent act, the leaders have been sectors like Energy, Financials, and Tech which are the three top-performing sectors. On the other hand, Real Estate, Utilities, and Consumer Staples have been some of the worst-performing sectors.

But looking at the relative strength charts of the eleven sectors versus the S&P 500 over the past year, there have been some reversals recently, meaning some of the trends that have been in place over the past few months are turning a corner. For example, the relative strength lines of Energy and Financials—the two best performing sectors since November—have generally been in uptrends during the current “act” meaning they have outperformed the broader S&P 500. But in the past couple of weeks, the relative strength lines of both Energy and Financials have broken those uptrends. The Industrials sector has seen the same play out while the Materials sector is sitting right at the bottom of its multi-month uptrend.
On the other hand, Technology—which has been the third best performing sector—has seen its relative strength line make a break higher alongside Communication Services. While a less recent development, Consumer Discretionary has also seen its relative strength line resume its uptrend. Perhaps more interestingly, some defensive sectors like Real Estate and to a lesser degree Utilities have been the laggards of the current act, but have seen their relative strength lines turn higher recently. For the former, this recent uptick has broken the past year’s downtrend. Granted, the same trends are still very much in place for the other two defensives: Consumer Staples and Health Care. Click here to view Bespoke’s premium membership options for our best research available.

Guns A’ Blazin’
Earnings Season Selling
Our Earnings Explorer tool allows users to track every single earnings report throughout earnings season to find individual stock opportunities or identify broader macro trends through our summary analysis. The tool contains data on more than 155,000 individual quarterly earnings reports from stocks dating back to 2002! There are countless ways for a user to filter and analyze the data to find what they’re looking for. It’s a must-try product that you can access with a two-week free trial to Bespoke Institutional.
Using our Earnings Explorer, we found that 417 companies had reported earnings since the current reporting period began on January 11th. As shown in the snapshot from the tool below, 84% of these companies beat bottom-line analyst EPS estimates, while 77% beat top-line sales estimates. In terms of guidance, 14% of companies have raised forward guidance while just 2% have lowered guidance.
What has been notable about this earnings season is the price action that stocks are seeing after they report their quarterly numbers. On average, stocks that have reported have gained 0.41% at their first open of trading after their earnings release. This means stocks are initially reacting positively to the earnings news. From the open to the close of trading after the initial gap higher, though, stocks that have reported have averaged a decline of 1.67%. Combining the opening gap and the open to close move, the average full one-day change for stocks reporting earnings stands at -1.28% this season. That’s a pretty bad number that’s indicative of a “sell the news” reaction.
The snapshot below also shows the stocks that have reacted the most positively to their earnings reports so far this season. Pot-stock company Aphria (APHA) has seen the best reaction of any company to report so far with a one-day gain of 21.1%. As it stands now, Netflix (NFLX) has seen the second-best reaction to earnings with its one-day gain of 16.85% on January 20th (it reported after the close on 1/19).

There have been ten stocks that have dropped more than 10% on their earnings reaction days this season, and we list them below. The three biggest losers have been software company Agilysis (AGYS), Pitney Bowes (PBI), and Harley Davidson (HOG). To use our Earnings Explorer tool and access everything else Bespoke’s research platform has to offer, start a two-week trial to Bespoke Institutional today.

B.I.G. Tips – Charts We’re Watching – 2/3/21
Bespoke’s Morning Lineup – 2/3/21 – Moving On
See what’s driving market performance around the world in today’s Morning Lineup. Bespoke’s Morning Lineup is the best way to start your trading day. Read it now by starting a two-week free trial to Bespoke Premium. CLICK HERE to learn more and start your free trial.
“I very frequently get the question: ‘What’s going to change in the next 10 years?’ And that is a very interesting question; it’s a very common one. I almost never get the question: ‘What’s not going to change in the next 10 years?’ And I submit to you that that second question is actually the more important of the two — because you can build a business strategy around the things that are stable in time. – Jeff Bezos
A strong earnings report from Amazon.com (AMZN) last night was overshadowed by the news that founder and CEO Jeff Bezos would be stepping down to take on the role of executive chairman beginning on July 1st. While the news made headlines, Bezos isn’t going anywhere; he’s only going to be less active in the day-to-day operations of the company which reports suggest he already has been for some time.
While Jeff Bezos is symbolically moving on from running the company he founded, we’ve also passed the peak of earnings season as all of the mega-caps have now reported quarterly numbers. There are still a lot of individual companies scheduled to report, but the companies representing much of the market cap for the S&P 500 have already reported. Investors will now have to find another issue to focus on, and that will likely be the progression of economic and COVID data which are both intertwined. One economic data point out this morning was the ADP Private Payrolls report which topped expectations by more than 100K (174K vs 70K).
Be sure to check out today’s Morning Lineup for updates on the latest market news and events, earnings reports from around the world, an update on Markit Services PMIs, an update on the latest national and international COVID trends, and much more.

The price of bitcoin has been consolidating in recent weeks after its surge to end 2020, but prices of ethereum have been climbing to new highs. The chart below shows the ratio of ethereum to bitcoin over the last twelve months, and ethereum’s strength has caused the ratio to breakout above its highs from the end of last summer.

From a longer-term perspective, ethereum’s rally has also taken the ratio above its highs from early 2019 as well, but still well off its record highs from early 2018. While ethereum still trades for less than one-twentieth of the price of bitcoin back in early 2018 it was as much as one-tenth of the price. In other words, even after the recent rally, ethereum’s price relative to bitcoin is close to historical lows than highs.

Daily Sector Snapshot — 2/2/21
Bespoke’s Consumer Pulse Report — February 2021
Bespoke’s Consumer Pulse Report is an analysis of a huge consumer survey that we run each month. Our goal with this survey is to track trends across the economic and financial landscape in the US. Using the results from our proprietary monthly survey, we dissect and analyze all of the data and publish the Consumer Pulse Report, which we sell access to on a subscription basis. Sign up for a 30-day free trial to our Bespoke Consumer Pulse subscription service. With a trial, you’ll get coverage of consumer electronics, social media, streaming media, retail, autos, and much more. The report also has numerous proprietary US economic data points that are extremely timely and useful for investors.
We’ve just released our most recent monthly report to Pulse subscribers, and it’s definitely worth the read if you’re curious about the health of the consumer in the current market environment. Start a 30-day free trial for a full breakdown of all of our proprietary Pulse economic indicators.

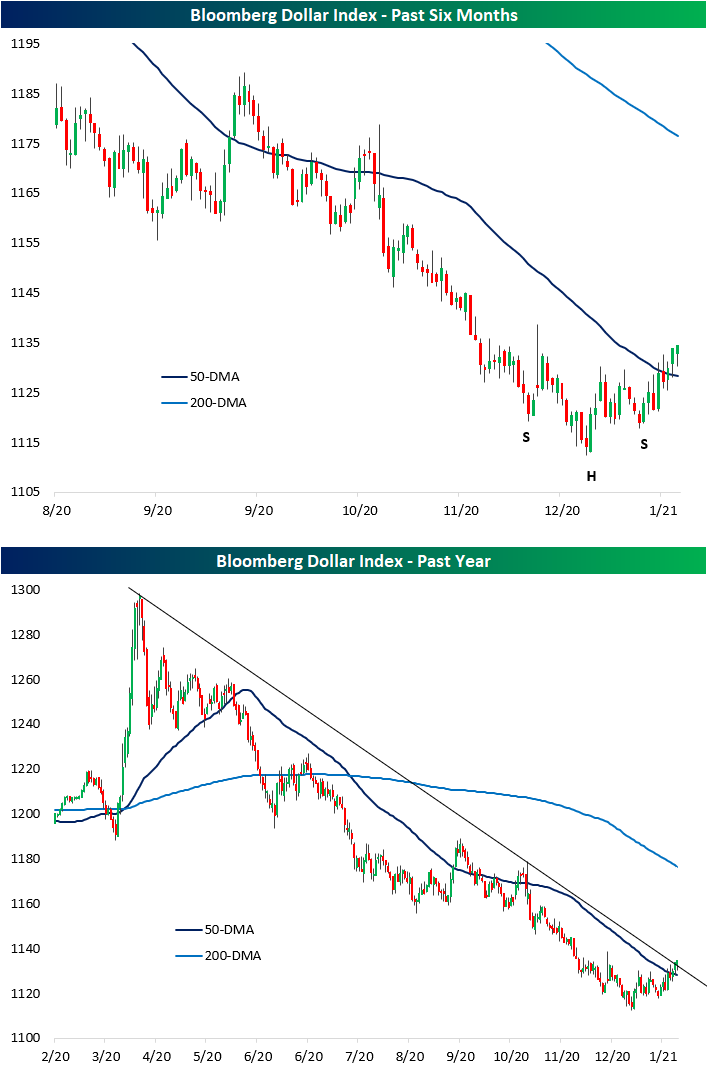
Dollar and Domestics Rebound
In the final weeks of January and carrying through to today, the US dollar has been in rally mode. The Bloomberg Dollar index is now up 1.82% off the January 6th low having reclaimed its 50-DMA in the process. With a higher low now in place, over the past couple of months the dollar has appeared to have formed an inverse head and shoulders pattern which is typically viewed as a bullish set-up. As shown in the second chart below, this recent rally is also leading the dollar to test the downtrend line that has been in place since its high on March 23rd of last year.
In periods of dollar strength, companies with a higher share of revenues generated domestically stand to benefit while companies with heavy international revenue exposure are hurt. In the past year, we have generally seen that play out. From the 2020 high for the dollar on March 23rd through the recent low early last month, Russell 1,000 stocks with heavy international exposure (those in our International Revenues database who generate less than half their revenues domestically) outperformed with an average gain on 109.44%. By comparison, stocks with 90% of more of their revenues generated domestically rose 97.11% in the same time frame. Since the dollar low on January 6th, that has reversed. Whereas the basket of internationals is flat since early January, domestics are up 1.56% on average.

For a bit more granularity, we broke the Russell 1,000 into deciles based on international revenues. The tenth decile is made up of those stocks with the entirety of their revenues generated at home while the first decile is comprised of stocks with the highest share of international revenues. Again, from the dollar’s high to low, internationals outperformed while the tenth and seventh deciles were the two worst performing.
As for the past few weeks, the only deciles to have declined have been deciles 2 and 3. While not in the red, the first decile of stocks with the highest share of international revenues have been laggards as well. On the other hand, stocks with higher shares of domestic revenues have generally done better. Click here to view Bespoke’s premium membership options for our best research available.
