Bitcoin’s Big Day
When it was MicroStrategy (MSTR), it was dismissed as a gimmick, but now that Tesla (TSLA) has used a big chunk of the cash on its balance sheet to buy bitcoin, more people are going to take notice. TSLA hasn’t historically been a company to shy away from publicity, so some will write off today’s announcement as a marketing stunt, but at $1.5 billion, it would be a pretty big stunt. Also, while it’s easy to forget, TSLA is one of the largest companies in the world.
Prior to TSLA’s announcement, bitcoin was already up on the day, but once the news hit, the rally reached a whole different level. Bitcoin is currently trading up over 11% on the day making it the best one-day rally for the crypto-currency since last April.
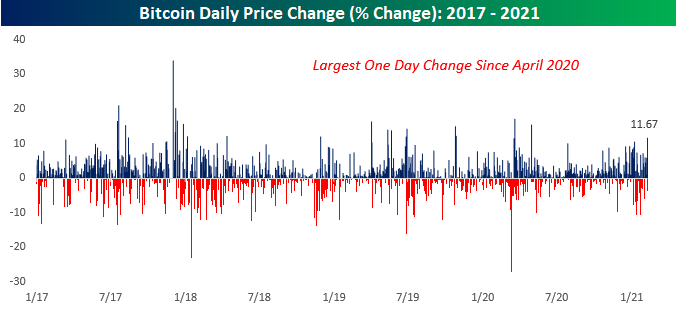
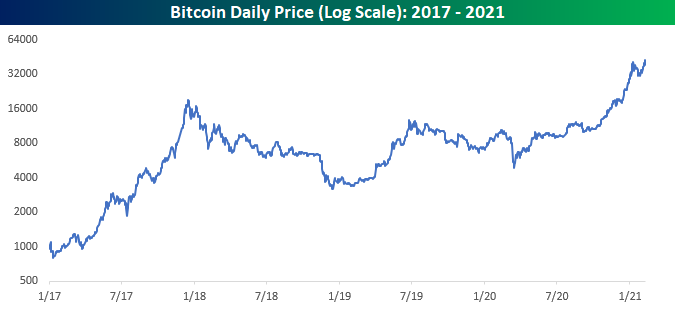
With today’s rally, bitcoin is also breaking out above its highs from early January and trading at over $43K.

Not only is bitcoin at new highs for the year, but the late 2020 breakout after three years of consolidation is continuing to gain steam.
One of the primary arguments for bitcoin these days is it serves as a digital store of value- or gold 2.0. Based on the relative strength of bitcoin versus gold, gold 1.0 looks a lot less shiny these days. When bitcoin last peaked in late 2017, the ratio of bitcoin to gold peaked at just under 15. A year ago today, the ratio was under six ounces of gold for every bitcoin. Back in early January, the ratio surged to more than 21 ounces of gold for every bitcoin. After this morning’s rally, though, one bitcoin is worth more than 23 ounces of gold, and the ratio increases by one ounce for every 4% rally in bitcoin.

So where does interest with the general public currently stand towards bitcoin? One way to track interest is through Google Trends. The chart below shows search trends for the term ‘bitcoin’ over the last five years. As bitcoin ran up to record highs in late 2020 and early 2021, search interest also picked up but peaked out at levels nowhere even close to where search interest was at the prior peak. This could be read in one of two different ways. The bullish case would be that enthusiasm for bitcoin is nowhere near as high now as it was back then, so there’s still much more room to run. A less bullish take, however, would be that back in late 2017, no one had ever even heard of bitcoin, so they were looking it up just to figure out what it was. Three years later, though, most people are at least familiar with what bitcoin is, so there is less reason to search for it. Click here to view Bespoke’s premium membership options for our best research available.

Bespoke’s Morning Lineup – 2/8/21- How Much Bitcoin is on the Balance Sheet?
See what’s driving market performance around the world in today’s Morning Lineup. Bespoke’s Morning Lineup is the best way to start your trading day. Read it now by starting a two-week free trial to Bespoke Premium. CLICK HERE to learn more and start your free trial.
“Everyone is digging deeper into their own trench and rarely standing up to look in the next trench over, even though the solution to their problem happens to reside there.” – David Epstein – Range
Equity markets are picking up this week right where they left off last week, and the major averages are all indicated to open the week higher. The big news of the morning has been Tesla’s (TSLA) announcement that it has purchased $1.5 billion in bitcoin with its cash on the balance sheet. TSLA is hardly considered a tradtional company, but when one of the largest companies in the world starts to hold bitcoin on its balance sheet as a substitute for cash, the market takes notice. Not surprisingly, bitcoin is trading up ~15% in the wake of TSLA’s announcement.
Be sure to check out today’s Morning Lineup for updates on the latest market news and events, earnings reports from around the world, crude oil prices, an update on the latest national and international COVID trends, and much more.

Weeks like the last one don’t come around all the time. With a 4%+ gain for the S&P 500, every one of the index’s major sectors finished in positive territory for the week. Leading the way higher, Energy surged over 8%, while Communication Services, Financials, and Consumer Discretionary all tacked on more than 6%. Following the rally, though, most sectors are overbought, including Communication Services and Real Estate which are both at ‘Extreme Overbought’ levels (more than two standard deviations above their 50-day moving average). Given the strength, we were a bit surprised to see that three sector ETFs still have timing scores that rank as ‘good’ in our Trend Analyzer.

Bespoke Brunch Reads: 2/7/21
Welcome to Bespoke Brunch Reads — a linkfest of the favorite things we read over the past week. The links are mostly market related, but there are some other interesting subjects covered as well. We hope you enjoy the food for thought as a supplement to the research we provide you during the week.
While you’re here, join Bespoke Premium with a 30-day free trial!
GameStop Madness
GameStop Day Traders Are Moving Into SPACs by Amrith Ramkumar (WSJ)
With prices and volatility both subsiding in popular “meme” stocks, investors looking to get ahead of the next pump are turning to SPACs for their big gains. [Link; paywall]
A GameStop Evangelist’s Videos Draw a Regulator’s Attention by Matthew Goldstein (NYT)
Massachusetts securities regulators are looking in to a trader at the center of the GameStop stocks urge for potential violations of supervisory protocols at his former company. [Link; soft paywall]
YouTuber David Dobrik Said He’s Lost $85,000 From Investing In GameStop Stock During The Hype by Tanya Chen (BuzzFeed)
A popular social media influencer reported that he lost $85,000 buying GameStop stock near the peak of the parabolic move in the stock that subsided over the past week. [Link]
Barstool founder Dave Portnoy sells GameStop, AMC shares at $700K loss by Thornton McEnery (NYP)
After collecting a big payday selling his company to Penn National, Dave Portnoy has taken to the markets, and in the latest round of fun turned himself into a GameStop bagholder. [Link; auto-playing video]
What Robinhood Traders Need to Know About Taxes by Laura Saunders (WSJ)
Active traders are going to face an absolute deluge of tax forms and actual levies, with the ten million other new retail traders who entered the market last year destined to learn hard lessons about both how much tax they owe and how big of a pain it is to file those taxes. [Link; paywall]
Back End & Brokering
GameStop Frenzy Puts Spotlight on Trading Giant Citadel Securities by Alexander Osipovich (WSJ)
Market maker and hedge fund Citadel has gotten lots of attention this week for their role in facilitating order flow from retail traders, and not all of it is positive. [Link; paywall]
Jane Street: the top Wall Street firm ‘no one’s heard of’ by Robin Wigglesworth (FT)
Another high frequency firm that makes markets specifically focused on ETFs has bene having a very good year and is also attracting an unusual amount of scrutiny. [Link; paywall]
Aligning with our community by Public (Medium)
In an effort to improve trust in their product, one of the free-to-trade brokerages has decided to stop accepting payment for order flow, and instead operate on a “tip” model. Good luck, we guess. [Link]
Cake
Why Do King Cakes Have Plastic Babies Hidden Inside? by Lindsey Liles (Garden & Gun)
If you’ve ever had a King Cake, you might have bitten in to a plastic baby. Here’s where that odd ingredient comes from. [Link]
Props
It’s flipping madness: ‘Startling’ amount bet on Super Bowl coin toss by David Purdom (ESPN)
Every year, millions of dollars are bet on a negative expected-value outcome that puzzles even the least rational among us; why are people paying as much as 5% of their bet on the outcome of a coin toss? [Link]
Crypto
Visa Signals Further Crypto Ambitions With API Pilot for Bank Customers to Buy Bitcoin by Nathan DiCamillo (Coindesk)
The mainstream payments giant is creating a new suite of APIs that allows banks to offer crypto products side-by-side with traditional financial services. [Link]
India plans to introduce law to ban Bitcoin, other private cryptocurrencies by Manish Singh (TechCrunch)
India is taking steps to ban crypto in the country, instead offering an official digital currency that it will roll out via new legislation later this year. [Link]
Tech Dystopia
There Are Spying Eyes Everywhere—and Now They Share a Brain by Arthur Holland Michel (Wired)
A Montreal company is attempting to put all surveillance techniques available to law enforcement into a single platform, offering a panopticon-like vision of the future. [Link; soft paywall]
Elon Musk Makes Characteristically Wild Debut on a Buzzy Social App Clubhouse by Reed Stevenson (Bloomberg)
The new conversation-sharing app Clubhouse featured a conversation with Tesla CEO Elon Musk this week, and it proved predictably wild with topics including bitcoin, Mars, Robinhood, aliens, monkey brains, and the COVID-19 vaccine. [Link; soft paywall]
A 25-Year-Old Bet Comes Due: Has Tech Destroyed Society? by Steven Levy (Wired)
A quarter century ago, an author and a journalist entered into a bet about the fate of society. While a winner has been declared, the victory was much narrower than might be expected. [Link]
Tech Utopia
The Environmental Upside of Modern Farming by Robert Paarlberg (WSJ)
If the world is going to feed its teeming billions into the 22nd century, it’s going to need a lot of productivity from farms. The good news is that productivity is booming, with use of pesticides dropping 80% since their 1972 peak while water and energy use are both down over 40% on a per-bushel basis. [Link; soft paywall]
Hard Currency
Gold, silver coin demand surging, straining U.S. Mint’s capacity by Devika Krishna Kumar (Reuters)
Sales of gold coins rose 258% last year, with silver coin sales up 28% per data released by the US Mint this week, and heavy buying has continued since. [Link]
Essential Workers
Covid Wears On, Essential Workers Carry On: ‘Everybody Forgets That You’re Still on the Front Line’ by Jennifer Levitz, Valerie Bauerlein and Alejandro Lazo (WSJ)
The front lines and greatest sacrifices of the COVID pandemic aren’t always in ICUs but very often in jobs that simply have to be done to keep the wheels turning. [Link; paywall]
Read Bespoke’s most actionable market research by joining Bespoke Premium today! Get started here.
Have a great weekend!
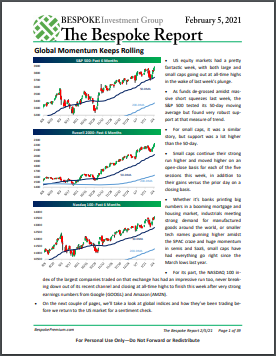
The Bespoke Report – 2/5/21 – Global Momentum Keeps Rolling
The US equity market closed the week at record highs and stock markets around the world have roared back from last week’s lows amidst lower bond prices and an onslaught of earnings. We dive deep into the results and performance for US companies reporting this season, as well as diving into markets across Europe and Asia to take a look at results from names reporting since last Friday.
In addition to earnings and equity prices, we review economic data in the US and around the world, the outlook for the world’s most important currency market, rotation within the commodities space, and more in this week’s Bespoke Report.
This week’s Bespoke Report newsletter is now available for members.
To read the report and access everything else Bespoke’s research platform has to offer, start a two-week free trial to one of our three membership levels. You won’t be disappointed!

Daily Sector Snapshot — 2/5/21
Sector Performance Disparities
What a week. Not just because the S&P 500 rebounded from last week’s dip to rally more than 4%, but also for the disparities in sector performance across different market caps.
The chart below shows sector performance for S&P 500 (large-cap) sectors this week. Leading the market higher this week, Energy led the way with a gain of 8.3%, followed by Communication Services (+7.3%), Financials (+6.6%), and Consumer Discretionary (+6.0%). At the other end of the spectrum, Health Care was the only sector that didn’t rally more than 1%.

While large-cap Health Care was the worst performing sector this week, a number of individual stocks in the sector had phenomenal weeks. The chart below shows the 25 top-performing Russell 3000 stocks this week. Of the 25 stocks listed, 17 come from the Health Care sector, including each of the top three and four of the top five!

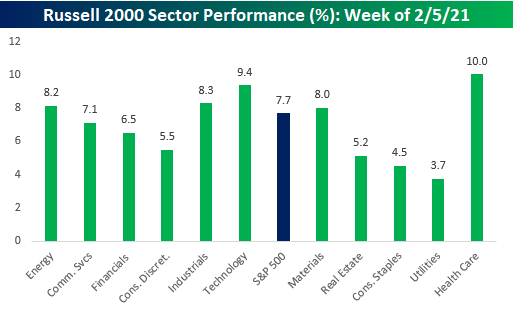
The chart below shows the performance of small cap sectors this week shown in the same order as the sectors above. While large-cap Health Care was the worst-performing sector of the week, in the small-cap space, Health Care was the top-performing sector! Health Care had the largest disparity in terms of sector performance between large and small caps, other sectors that saw pretty sizable disparities were Technology, which barely outperformed in the large cap space but was the second best performing sector in the small cap space, Materials, and Industrials. It’s typically common for sector perofrmance to be similar across the market cap spectrum, but this week certainly proved to be an exception. Click here to view Bespoke’s premium membership options for our best research available.
Super Bowl LV: Time to Break the Tie – Go Bucs!
This year’s Super Bowl will be a first for many different reasons. It will be the first-ever game played in the home stadium of one of the teams playing. It will be the first-ever game with a 43-year-old starting QB. The age difference between the starting QBs will be the widest ever (18+ years). The game will not be played to a full stadium (attendance capped at 25K). We could go on. Another interesting aspect of this year’s game is that it will break the tie between the AFC and NFC for the number of championships won (27). The last time the two conferences had an equal number of Super Bowl titles was back in 1990 after Super Bowl XXIV when each conference had 12. The New York Giants broke that tie in 1991 when Scott Norwood went ‘wide ride’ to give the NFC its 7th straight and 13th total Super Bowl victory. From there, the NFC continued its domination of the AFC (and the Bills) winning the next six championship games, including three against the Bills.

We’ve all heard of the Super Bowl market indicator which says that a win for the NFC bodes well for the equity market while an AFC victory is a bearish signal. For years, there actually was a wide gap in performance for the market following wins by either conference in the past, but in recent years the disparity has narrowed. In the 27 years where the AFC has won the Super Bowl, the S&P 500 averaged a rest of year gain of 6.9% with positive returns 70% of the time. When the NFC wins, though, the S&P 500’s average rest of year performance has been a gain of 10.5% with positive returns more than 77% of the time.

When it comes to individual teams, 13 have won the Super Bowl more than once. The two teams with the most victories are the Steelers and Patriots each of which has won the game six times. The Dallas Cowboys often refer to themselves as ‘America’s Team’ but Pittsburgh is the “Stock Market’s Team”. In the six years where the Steelers won the Super Bowl, the S&P 500 experienced positive returns for the remainder of the year every time for an average gain of 18.8%! Market returns for the Patriots following their six victories have been a much more muted 4.6%, including a decline of more than 21% from the end of the team’s first victory in 2002. The 49ers and the Broncos have ‘only’ won five and three Super Bowls, respectively, but following their victories, the S&P 500 has been up for the remainder of the year every time for an average gain of more than 20%!
So, what about this year’s teams? The Chiefs have won the Super Bowl twice in their history, and the S&P 500 has averaged a rest of year gain of 8.1% following their victories. While the S&P 500 was down for the remainder of the year after they won in 1970, the decline was less than 1%. The one year the Chiefs made it to the championship but lost, the S&P 500 was up over 14% for the remainder of the year.
For the NFC, Tampa Bay’s one and only appearance in the Super Bowl was in 2003 (XXXVII). They won that game, and the S&P 500’s rest of the year gain was over 29%. Additionally, while they’re on a new team now, in the three Patriots victories where Tom Brady and Rob Gronkowski were both on the team, the S&P 500 was higher for the remainder of the year all three times for an average gain of 12.7%. Go Bucs! Click here to view Bespoke’s premium membership options for our best research available.

Bespoke’s Morning Lineup – 2/5/21 – Jobs Day
See what’s driving market performance around the world in today’s Morning Lineup. Bespoke’s Morning Lineup is the best way to start your trading day. Read it now by starting a two-week free trial to Bespoke Premium. CLICK HERE to learn more and start your free trial.
“Gambling, beer and football filled the horizons of their minds.” – George Orwell
It may be Super Bowl weekend, but most people looking to enjoy a couple of beers watching the game this year will be following the lead of George Thorogood and drinking those beers alone- or at least with nothing more than a small group! Before we get to thinking about Sunday’s game, though, we still have the last trading day of the week to get through, and what a week it has been. The S&P 500 is up over 4% and on pace for its best week since the Election.
The January Non-Farm Payrolls report was just released and the results were mixed. While total Non-Farm Payrolls rose less than expected (49K vs 105K), the Unemployment Rate fell to 6.3% versus expectations for 6.7%. Average hourly earnings were slightly weaker than expected at 0.2% on a month over month basis, but because of revisions showed a larger than expected y/y increase. The average workweek spiked up to 35 hours which is a level that hasn’t been seen in years. Despite millions of jobs lost since the start of the pandemic, Americans who are working are working more and earnings more than they have in years.
Be sure to check out today’s Morning Lineup for updates on the latest market news and events, earnings reports from around the world, economic data out of South Korea and Europe, an update on the latest national and international COVID trends, and much more.
What a difference a week makes. In last week’s Bespoke Report and our B.I.G. Tips report from Sunday evening, we noted that after the declines from the prior week, major US index and sector ETFs had sen their timing scores in our Trend Analyzer shift from mostly ‘Poor’ to ‘Good’. Below is a snapshot of where things stood for US indices through last Friday’s close. Over the trailing five trading days, every index ETF was down, but with the exception of the Micro-Cap ETF (IWC), every ETF had a ‘Good’ timing score.

After the gains of the last four trading days, the picture has changed a lot. Over the last five trading days, every ETF in the Trend Analyzer was up over 1% and most are up well over 2%. With these gains, all of the ETFs have now moved back into overbought territory, and all of the timing scores have now shifted to ‘Neutral’ or ‘Poor’. That doesn’t mean that the market will necessarily pull back from here, but the risk/reward is skewed more towards the risk side again. As always, pick your spots.

The Bespoke 50 Top Growth Stocks — 2/4/21
Every Thursday, Bespoke publishes its “Bespoke 50” list of top growth stocks in the Russell 3,000. Our “Bespoke 50” portfolio is made up of the 50 stocks that fit a proprietary growth screen that we created a number of years ago. Since inception in early 2012, the “Bespoke 50” is up 472.7% excluding dividends, commissions, or fees. Over the same period, the S&P 500 is up in price by 180.4%. Always remember, though, that past performance is no guarantee of future returns. To view our “Bespoke 50” list of top growth stocks, please start a two-week free trial to either Bespoke Premium or Bespoke Institutional.
