All or Nothing Days on the Rise
We consider an ‘all or nothing day’ to be a day where the net daily breadth reading (daily advancing stocks minus declining stocks) for the S&P 500 is above +400 or below -400. While these types of days were practically non-existent in the 1990s, beginning in the early 2000s, their frequency started to rise with the increased popularity of trading in the S&P 500 ETF (SPY). Whereas investors used to buy and sell individual stocks, the increased popularity of SPY moved the market more towards the type of environment where investors were buying and selling the market.
All or nothing days also increase in frequency during periods of increased market volatility, and that trend has been no different this time around either. The chart below shows the 50-day moving average of all or nothing days going back to 1990. Over the last 50 trading days, more than a third of all trading days have been all or nothing days. The only two other times where the average was higher in the last thirty years were in December 2008 and November 2011. The average got close to current levels back in late 2015 and early 2016 but was never able to quite get above 33%.
Looking at the frequency of all or nothing days on an annual basis shows another interesting trend. So far this year, there have been 19 all or nothing days for the S&P 500. We may be barely a quarter into 2020 so far, but this year’s total already ranks above more than half of the 31 years since 1990. In fact, the S&P 500 is currently on pace to have 70 all or nothing days in 2020, which would tie 2011 for the most ever in a given year. It’s only April, but 2020 is shaping up to be the year of record volatility. Start a two-week free trial to one of Bespoke’s three premium memberships to see our best and most actionable market analysis.
Chart of the Day – Gauging the Crash and the Bounce
Bespoke’s Morning Lineup – 4/8/20 – Morning Drift
See what’s driving market performance around the world in today’s Morning Lineup. Bespoke’s Morning Lineup is the best way to start your trading day. Read it now by starting a two-week free trial to Bespoke Premium. CLICK HERE to learn more and start your free trial.
US futures have been gradually drifting higher all morning and are now indicating a gain of nearly 1% for the S&P 500 at the open. In terms of data today, there isn’t much on the economic front, so the primary focus of investors is going to be on trends in COVID-19 case counts both here in the US and abroad.
Read today’s Bespoke Morning Lineup for a discussion of the latest trends and statistics of the outbreak, trading in European markets, and the latest on the political back and forth between EU member countries on how to deal with virus relief.
In yesterday’s post, we noted that Financials was the only S&P 500 sector still trading at oversold levels. Even with yesterday’s negative reversal in the S&P 500, the Financials managed to finish slightly in the green and more importantly, out of oversold territory. With that move, it was the first time in 51 trading days that at least one S&P 500 sector was not in oversold territory. That may sound like a long time, but it is nowhere near a record. In late 2016, the S&P 500 went 74 straight days where at least one sector was oversold, and there have been multiple periods in the past when there were streaks of 100 or more trading days with at least one sector oversold. That was before the days of ETFs where the market was a lot less one-sided on a day to day basis.

What is rather unique about the recent period is that back in late March, there was a 13 trading day stretch where every S&P 500 sector finished the day at oversold levels. Going back to 1990, there has only been one other longer streak. That was in October 2008 when every sector was at oversold levels for a full 17 straight trading days.

The Closer – Turndown Tuesday – 4/7/20
Log-in here if you’re a member with access to the Closer.
Looking for deeper insight on markets? In tonight’s Closer sent to Bespoke Institutional clients, we recap the wild session on Wall Street with a look at where implied volatility stands. We then show crude oil’s role in today’s action before pivoting over to the different moves across market caps. We close out tonight with a look at commercial paper.
See today’s post-market Closer and everything else Bespoke publishes by starting a 14-day free trial to Bespoke Institutional today!
Daily Sector Snapshot — 4/7/20
Chart of the Day: Looking for Confirmation
Volatility Remains High
Given the big rally off the lows of late March, we’ve had a number of questions related to the VIX and why it remains high. As of Tuesday afternoon, the VIX was in the mid-40s which is very high relative to readings over the last decade but actually down significantly from its recent highs above 80.
The reason the VIX is still in the 40s is because the market remains volatile. While volatility is typically associated with markets that are moving lower, it can actually go both ways, which is exactly what we’re seeing now. The charts below do a good job of illustrating just how extraordinary the market’s swings have been in recent weeks. In many cases, it’s unlike anything anyone reading this has ever seen before.
Over the last five weeks, the S&P 500’s average absolute daily percentage change has been +/-4.8%. That’s higher than we saw at the height of the financial crisis, after the 1987 crash, and in the late stages of the Great Depression. The only time the S&P’s average daily move over a five-week period was greater was after the Crash of 1929.
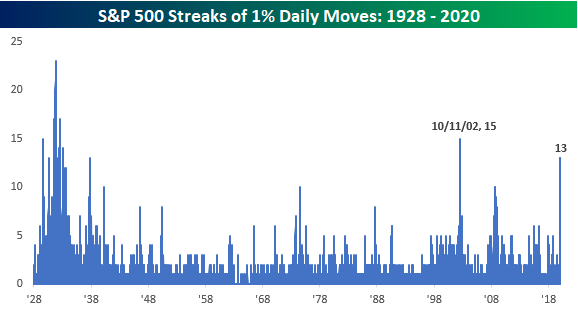
Tuesday’s rally also puts the S&P 500 on pace for its 13th straight day of moving up or down 1% or more. That’s a longer streak than anything seen during the Financial Crisis and just two shy of the 15 straight days we saw in October 2002 at the lows of that bear market. Before that, though, the only other period where there was a longer streak of 1% daily moves was during the Great Depression.
While 13 straight daily 1% moves is extreme by any measure, what makes this current streak even more notable is that it would be the second 13-day streak of 1% moves in the last 27 trading days. That’s right, from 3/2 through 3/18, the S&P 500 went 13 straight days of moving up or down 1%. Then, on 3/19, the S&P 500 broke that streak by rallying just 0.47%. Since then, though, it’s been 1% all the time again with the S&P 500 on pace for its 13 straight daily move of 1% again. Looking at this another way, in the last five weeks (25 trading days) the S&P 500 has seen a 1% move 24 times. The only other time that has occurred was during the Great Depression when there were two separate occurrences. Start a two-week free trial to one of Bespoke’s three premium memberships to see our best and most actionable market analysis.
Infrastructure Spending: A Welcome Way To Push Up Activity After COVID Clears
Congress has already passed one relief bill (the CARES Act) which offers expanded unemployment benefits, cash payments to households, loans to businesses and state or local governments, and other provisions. Discussions continue about further stimulus. Congress would be well-served to consider either direct spending on infrastructure or grants to the states to do the same. As shown in the chart below, investment spending by governments at all levels has been historically low, and infrastructure spending would help economic recovery after the initial collapse and bounce-back in activity has played out. Start a two-week free trial to one of Bespoke’s three premium memberships to see our best and most actionable market analysis.
No Commercial Paper Credit Crunch
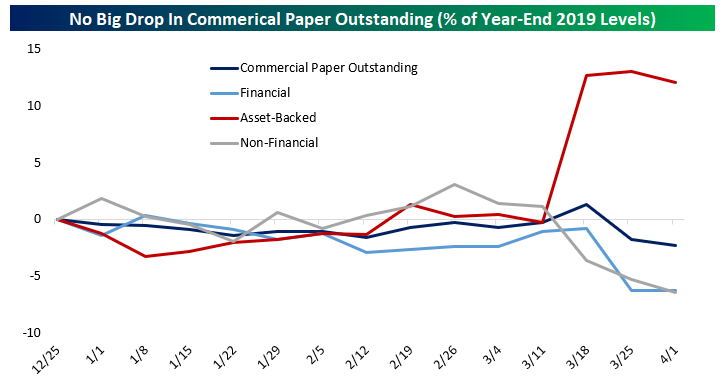
While financial markets have suffered major turmoil in 2020, at least commercial paper markets are open. Short-term debt issued by non-financial companies, banks, and securitizations of other assets in aggregate sits at about 2.5% of the level it recorded to end last year. Asset-backed issuance is up, while other categories are down, but the broad trend is for little change. This indicates that short-term funding markets may have been disrupted, but they’re still providing plenty of capital to borrowers. Fed programs to support money markets generally and commercial paper specifically have helped as well.
Compare the relative stability of commercial paper issuance year-to-date with the period of the global financial crisis between 2007 and 2009. As shown in the chart, asset-back commercial paper issuance peaked in 2007 and was falling sharply by Q4 of that year. Other categories were also in significant decline by late 2008 and that continued into 2009. Start a two-week free trial to one of Bespoke’s three premium memberships to see our best and most actionable market analysis.
Semis Holding Up Relative to Market
In a post yesterday, we noted that the relative strength of semiconductors versus energy had finally eclipsed its record high from the dot-com boom in March 2000. Semis have not only exhibited relative strength versus the energy sector; they’ve demonstrated strength versus the broader market as well. Take the relative strength of the Philadelphia Semiconductor Index (SOX) versus the S&P 500. In the early stages of the market decline from the February highs, semiconductors saw a sharp drop in their relative strength, but in late March, the SOX surged relative to the broader market and actually hit a record high on March 24th. With Technology playing an increased role in the stay-at-home and work-from-home economy, it makes sense that semis would hold up relatively well.
From that high on 3/24, we saw a modest pullback in the strength of the semis relative to the S&P 500, which then bounced again in recent days. Going forward, the key for the semis is over which level it breaks first. Will it be the March high or the short-term low three days later on 3/27 that followed. Whichever way it breaks will likely dictate which way the broader market goes as well.


