Chart of the Day – No Cushion From Treasuries
Bespoke’s Morning Lineup – 2/1/21 – Global Rally
See what’s driving market performance around the world in today’s Morning Lineup. Bespoke’s Morning Lineup is the best way to start your trading day. Read it now by starting a two-week free trial to Bespoke Premium. CLICK HERE to learn more and start your free trial.
“Short cuts make long delays.“ – J.R.R. Tolkien
When futures opened for trading last night, it was looking like January’s end of month weakness was going to continue right into the start of February. After the opening weakness, dip buyers stepped up in full force turning a weak start to the month into a strong one. Across the globe, equities are rallying, and strangely enough, GameStop (GME) shares are basically flat on the day!
Economic data is relatively quiet this morning with ISM Manufacturing and Construction Spending at 10 AM eastern. Both reports are expected to show a modest decline from last month’s pace of growth but are still expected to be positive.
We’d also be remiss not to mention the spike in silver this morning as Reddit traders are moving on from equities that investors have always loved to hate to silver – one of the least respected of the precious metals. In early trading, silver is up over 10% to its highest levels since 2013.
Be sure to check out today’s Morning Lineup for updates on the latest market news and events, earnings reports from around the world, economic data out of Europe, an update on the latest national and international COVID trends, and much more.

After a weak close to January, the S&P 500 ended at its lows of the month on Friday. That decline was also notable for the fact that it was the first time since the Election that the S&P 500 closed below its 50-day moving average and ended a streak of 58 straight trading days above that level.

At 58 trading days, the most recent streak of closes above the 50-DMA for the S&P 500 was a relatively long one but nothing extreme by historical standards. In the last 10 years alone, there have been 12 streaks of longer duration including the 102 trading day streak coming out of the COVID lows. In other words, while the S&P 500’s post-election rally has ended, it doesn’t necessarily mean the market is in for an extended period of market weakness either. Without pullbacks, there wouldn’t be rallies.

B.I.G. Tips – Lay of the Land
After trading up as much as 3% YTD last Tuesday morning, the final four trading days of the month erased all of those gains and then some. By the time the closing bell rang on the first month of 2021, the S&P 500 was down a little over 1% for the year and traded below its 50-day moving average for the first time since November 3rd.
Based on the month of January, if you were looking for a return to more normalcy in 2021 compared to 2020, don’t hold your breath.
With the first month of 2021 behind us, in our latest B.I.G. Tips report, we provided a broad overview of the market’s technical picture looking at the charts of all 60 S&P 500 Industry Groups. This review provides a good summary of which groups and sectors are leading and lagging the market as the S&P 500 post-election rally starts to consolidate.

For access to our latest report, make sure you sign up for a monthly Bespoke Premium membership now!
Bespoke Brunch Reads: 1/31/21
Welcome to Bespoke Brunch Reads — a linkfest of the favorite things we read over the past week. The links are mostly market related, but there are some other interesting subjects covered as well. We hope you enjoy the food for thought as a supplement to the research we provide you during the week.
While you’re here, join Bespoke Premium with a 30-day free trial!
Short Squeezes
The Piggly Wiggly Squeeze by Nick Maggiulli (Threader)
Today, iconic Southern grocery store Piggly Wiggly (a pioneer in the modern self-serve model) is privately held, but back in the Roaring Twenties it was the subject of a monster squeeze. [Link]
Hedge funds lose $30 billion on VW infinity squeeze (Mox Reports)
At the height of the financial crisis, Volkswagen was the subject of one of the largest short squeezes in the history of the financial markets thanks to some very impressive financial machinations by Porsche. [Link]
Legal Troubles
DoorDash Can’t Duck Restaurant’s False Advertising Suit by Nicholas Iovino (Courthouse News Service)
Delivery company DoorDash was dealt a blow this week by a federal judge who allowed a class action suit by restaurants to move forward. The suit alleges that the company set up pages for restaurants on its platform which labeled them closed or unavailable when they refused to partner. [Link]
Apollo CEO Leon Black to Step Down Following Review of Jeffrey Epstein Ties by Miriam Gottfried (WSJ)
The CEO of Apollo Global Management is resigning after an investigation into his relationship with deceased former financier and alleged sex trafficker Jeffrey Epstein showed 9 figure payments for “tax advice”. [Link; paywall]
Crypto
Ray Dalio calls bitcoin ‘one hell of an invention,’ considers it for new funds by Erik Schatzker (BNN Bloomberg)
The man behind the biggest hedge fund in the world has lots of technical praise for Bitcoin and is considering investing in crypto going forward. [Link]
Harvard, Yale, Brown Endowments Have Been Buying Bitcoin for at Least a Year: Sources by Ian Allison (Coindesk)
University endowments have been buying crypto on exchanges, with purchases dating back roughly 18 months, with a source estimating “some pretty nice chunks of return”. [Link]
MicroStrategy and Bitcoin: the Mother of All Fat Tails? by Bill Miller (Miller Value)
Crypto charts have gotten parabolic enough that income-focused value investors are busily racking up positions in convertible bonds in order to get exposure. [Link]
COVID
A Chick-fil-A manager stepped in to save a South Carolina drive-thru COVID-19 vaccination clinic by Mary Meisenzahl (Business Insider)
Chick-fil-a does a huge multiple of competitors’ weekly revenues per location despite being open one less day, and a key to its success is the performance of its drive-throughs. So it’s not a shock that the experience of running one is paying off at COVID vaccination sites. [Link]
Mortality Rates From COVID-19 Are Lower In Unionized Nursing Homes by Adam Dean, Atheendar Venkataramani, and Simeon Kimmel (HealthAffairs)
Union protections that insured PPE access for nursing home workers helped to prevent spread of the virus around homes and therefore limited mortality rates. [Link]
Bubbles
If It Looks Like a Bubble and Swims Like a Bubble… by James Mackintosh (WSJ)
A list of attributes which make the recent equity market bubble (especially its most frothy sections) pretty hard to deny. [Link; paywall]
It’s not just GameStop. Market bubble fears are rising by Matt Egan (CNN)
Another review of how the current equity market environment looks in real time like the kind of situation that was after-the-fact clearly a bubble in the past. [Link]
GameStop
Steve Cohen’s Point72 Loses 10-15% Amid Month’s Hedge Fund Carnage by Katherine Burton (Bloomberg)
The carnage for short sellers this week spread to Point72, which helped deliver more capital for besieged short sellers Melvin Capital and also booked double-digit losses. [Link]
Famed GameStop bull ‘Roaring Kitty’ is a Massachusetts financial advisor by Chris Prentice and Pete Schroeder (Reuters)
The Reddit trader that has ridden GME to profits in the tens of millions is a financial advisor who was recently employed by insurance giant MassMutual. [Link]
Innovation
Parkinson’s Meds Are Hard To Grab. So TikTok Users Crowdsourced A Solution. by Kait Sanchez (The Verge)
An online community came together to support Parkinsons sufferers with an innovative design for pill bottles which can be very difficult to navigate. [Link]
Ecology
Shark Populations Are Crashing, With a ‘Very Small Window’ to Avert Disaster by Catrin Einhorn (NYT)
Human fishing has led to a catastrophic plunge in shark populations around the world, with existing protections inadequate to protect species which have been navigating the deep for hundreds of millions of years. [Link; soft paywall]
Read Bespoke’s most actionable market research by joining Bespoke Premium today! Get started here.
Have a great weekend!
The Bespoke Report – 1/29/21 – “Power to the Players”
This week’s Bespoke Report newsletter is now available for subscribers. Here’s the intro:
Just when you thought you saw it all, along comes the saga of GameStop (GME). The stock’s rally, which actually has been going on for months but really went into orbit in the last few weeks, seems to make no fundamental sense. GME is basically the Blockbuster of video games. It sells physical versions of video games that most players are now buying digitally or streaming. None of this was news to anyone paying attention, and the stock had been a favorite of the short-selling community for years. If you were just coming to the eureka moment that the GME business model faced structural headwinds, you probably shouldn’t be in the investment business.
With such a stiff secular headwind howling in its face, GME’s surge has been completely written off as market manipulation and a concerted effort by the reddit community to take out the short-sellers. And when you see charts like this, it’s not fundamentals driving the stock. The trading in GME was originally written off as a bunch of ‘video-game playing yahoos’ on message boards blindly following each other, but in the story of GME that has emerged, there was a method to the madness. Fitting to GameStop’s motto, it was a “Power to the Players” moment, where we were reminded of the quote, “Within every lie, there is usually a hint of truth, and within every truth, there is always a hint of a lie.”
To read this week’s full newsletter and access everything else Bespoke’s research platform has to offer, start a two-week trial to one of our three membership levels.


Daily Sector Snapshot — 1/29/21
B.I.G. Tips – Retail Tossed Out With The Trash
Most Heavily Shorted Stocks at the End of 2020 and Now
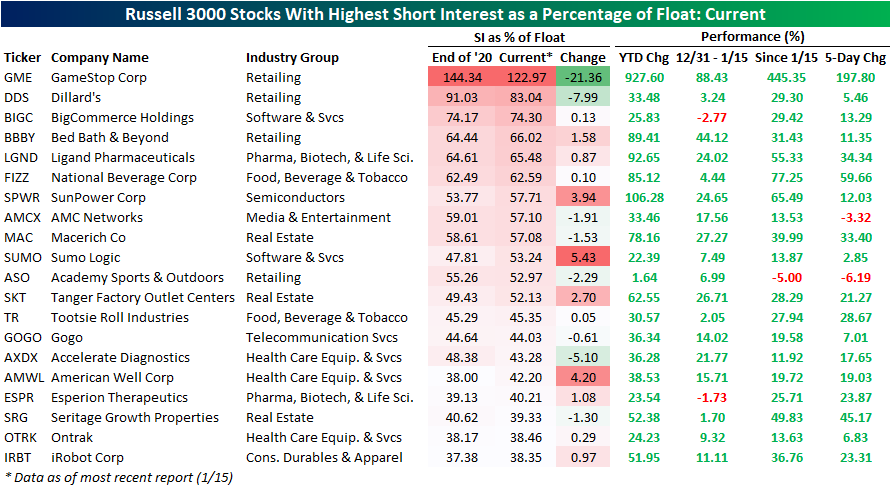
In the table below, we show the 20 stocks in the Russell 3000 that currently have the highest short interest as a percentage of float. It should come as no surprise that GameStop (GME) still tops that list with 122.97% of float short as of the most recent data for mid-month. That is even after a 21.36 percentage point drop from the end of 2020 when 144.34% of shares were short. It was also the most heavily shorted stock then. The runner-up is Dillard’s (DDS) which currently has 83.04% of shares sold short compared to over 90% at the end of 2020. Again, despite that sizeable decline in the percentage of shares sold short, it was also the second most heavily shorted stock one month ago. Of the rest of the top 20, there are six other names with lower short interest than the end of last year. Looking across the rest of the most heavily shorted stocks, Sumo Logic (SUMO), American Well Corp (AMWL), and Sunpower (SPWR) are the stocks that have seen their short interest as a percentage of equity float rise the most. In terms of stock price performance, SPWR has been the one with the biggest rally having doubled YTD. The only other stock that has doubled YTD in this cohort has been GME.
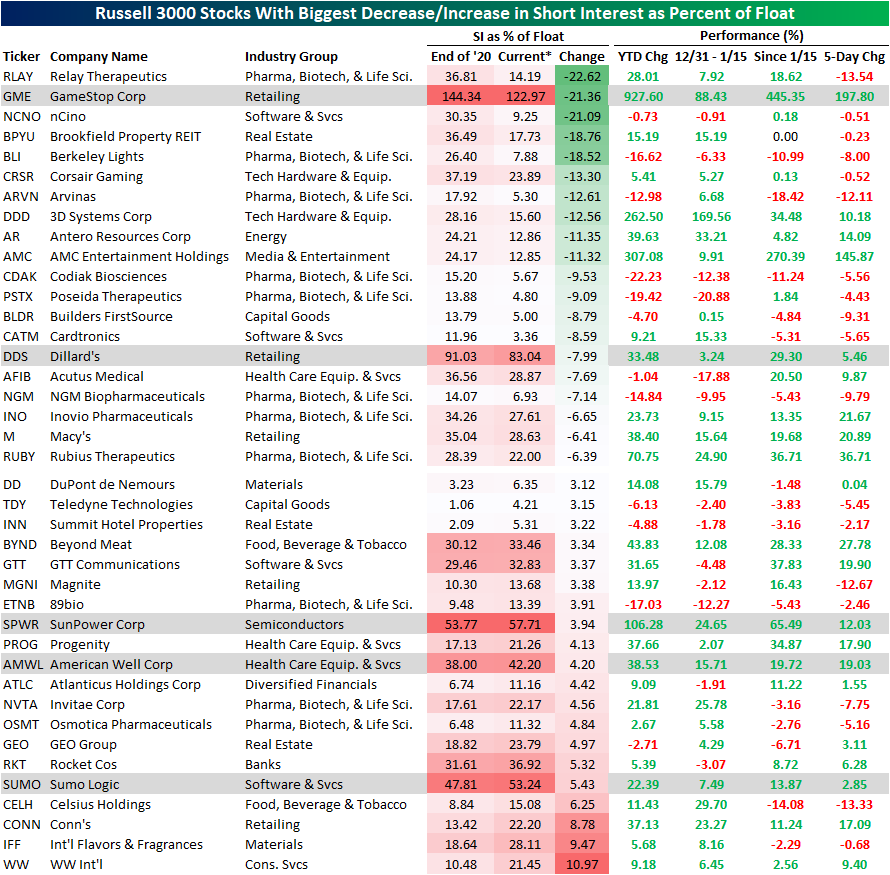
In the table below, we show the stocks that have seen the biggest changes in the percent of shares sold short between the end of 2020 and the most recent data as of January 15th. Those currently in the top 20 most shorted stocks are highlighted in gray. Across the entire Russell 3,000, 1,777 stocks have seen their short interest as a percent of short move lower in the two week period from the end of December to mid-January. As shown, even after the massive short squeeze that has taken place, GME is actually not the stock that has seen the biggest decline in shorts. Relay Therapeutics (RLAY) holds that title with a 22.62 percentage point decline. That is even though the stock has experienced a relatively smaller move than some of its peers. Granted, a number of other stocks like nCino (NCNO) and Berkeley Lights (BPYU) to name a few have actually moved lower so far in 2020 and have also seen their short interest decline significantly. On the other end of the spectrum, WW International (WW) has seen its short interest rise the most. Click here to view Bespoke’s premium membership options for our best research available.
Bespoke’s Morning Lineup – 1/29/21 – One Down…
See what’s driving market performance around the world in today’s Morning Lineup. Bespoke’s Morning Lineup is the best way to start your trading day. Read it now by starting a two-week free trial to Bespoke Premium. CLICK HERE to learn more and start your free trial.
“Look at market fluctuations as your friend rather than your enemy. Profit from folly rather than participate in it.” – Warren Buffett
We’re just about through the first month of 2021, and if you thought this year would be less chaotic than the last, don’t hold your breath. In a fitting end to what has been a crazy month in the markets, shares of GameStop (GME) and the other heavily shorted stocks out there are rallying on news that Robinhood would allow clients to trade the stocks again. The company drew on its credit lines and raised new capital last night to shore up its balance sheet, so hopefully, that will prevent a repeat of yesterday’s chaos.
In markets today, futures were already lower but are near their lows of the morning after JNJ released preliminary results of its COVID vaccine. While the initial numbers showed that the vaccine was effective, the overall efficacy doesn’t appear to be as strong as the Pfizer and Moderna vaccines already in circulation. One difference between the JNJ study and others, though, is that JNJ’s study took place during a period when other variants of the virus were in circulation, so more details on this will likely be forthcoming.
Be sure to check out today’s Morning Lineup for updates on the latest market news and events, earnings reports from around the world, economic data out of Europe, an update on the latest national and international COVID trends, and much more.
Shares of Caterpillar (CAT) are bucking the negative tone this morning after the company reported positive earnings results. One positive aspect of CAT’s results for the broader economy was that machinery sales saw a significant improvement. While overall machinery sales on a three-month average basis are still down on a global basis, they improved from a decline of 11% to a drop of just 2%. That’s the least negative level since November 2019.

The Bespoke 50 Top Growth Stocks — 1/28/21
Every Thursday, Bespoke publishes its “Bespoke 50” list of top growth stocks in the Russell 3,000. Our “Bespoke 50” portfolio is made up of the 50 stocks that fit a proprietary growth screen that we created a number of years ago. Since inception in early 2012, the “Bespoke 50” is up 444.8% excluding dividends, commissions, or fees. Over the same period, the S&P 500 is up in price by 174.2%. Always remember, though, that past performance is no guarantee of future returns. To view our “Bespoke 50” list of top growth stocks, please start a two-week free trial to either Bespoke Premium or Bespoke Institutional.
