Daily Sector Snapshot — 2/2/21
Bespoke’s Consumer Pulse Report — February 2021
Bespoke’s Consumer Pulse Report is an analysis of a huge consumer survey that we run each month. Our goal with this survey is to track trends across the economic and financial landscape in the US. Using the results from our proprietary monthly survey, we dissect and analyze all of the data and publish the Consumer Pulse Report, which we sell access to on a subscription basis. Sign up for a 30-day free trial to our Bespoke Consumer Pulse subscription service. With a trial, you’ll get coverage of consumer electronics, social media, streaming media, retail, autos, and much more. The report also has numerous proprietary US economic data points that are extremely timely and useful for investors.
We’ve just released our most recent monthly report to Pulse subscribers, and it’s definitely worth the read if you’re curious about the health of the consumer in the current market environment. Start a 30-day free trial for a full breakdown of all of our proprietary Pulse economic indicators.

Dollar and Domestics Rebound
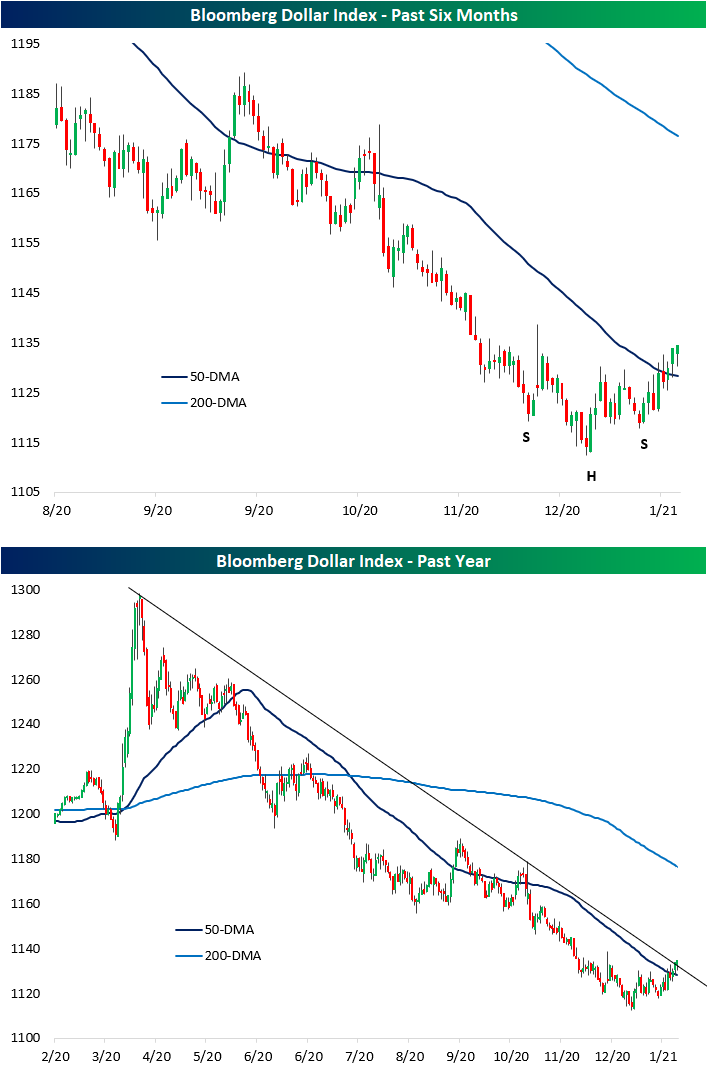
In the final weeks of January and carrying through to today, the US dollar has been in rally mode. The Bloomberg Dollar index is now up 1.82% off the January 6th low having reclaimed its 50-DMA in the process. With a higher low now in place, over the past couple of months the dollar has appeared to have formed an inverse head and shoulders pattern which is typically viewed as a bullish set-up. As shown in the second chart below, this recent rally is also leading the dollar to test the downtrend line that has been in place since its high on March 23rd of last year.
In periods of dollar strength, companies with a higher share of revenues generated domestically stand to benefit while companies with heavy international revenue exposure are hurt. In the past year, we have generally seen that play out. From the 2020 high for the dollar on March 23rd through the recent low early last month, Russell 1,000 stocks with heavy international exposure (those in our International Revenues database who generate less than half their revenues domestically) outperformed with an average gain on 109.44%. By comparison, stocks with 90% of more of their revenues generated domestically rose 97.11% in the same time frame. Since the dollar low on January 6th, that has reversed. Whereas the basket of internationals is flat since early January, domestics are up 1.56% on average.

For a bit more granularity, we broke the Russell 1,000 into deciles based on international revenues. The tenth decile is made up of those stocks with the entirety of their revenues generated at home while the first decile is comprised of stocks with the highest share of international revenues. Again, from the dollar’s high to low, internationals outperformed while the tenth and seventh deciles were the two worst performing.
As for the past few weeks, the only deciles to have declined have been deciles 2 and 3. While not in the red, the first decile of stocks with the highest share of international revenues have been laggards as well. On the other hand, stocks with higher shares of domestic revenues have generally done better. Click here to view Bespoke’s premium membership options for our best research available.

Bespoke Stock Scores — 2/2/21
Chart of the Day: Strong Morning After a Strong Day
Bespoke’s Morning Lineup – 2/2/21- Global Rally Continues
See what’s driving market performance around the world in today’s Morning Lineup. Bespoke’s Morning Lineup is the best way to start your trading day. Read it now by starting a two-week free trial to Bespoke Premium. CLICK HERE to learn more and start your free trial.
The stock market is a device to transfer money from the impatient to the patient.” – Warren Buffett
The global rally continued overnight as US futures are firmly in positive territory after the S&P 500 briefly tested its 50-DMA. The only area of the market not rallying are stocks (like GameStop and others) originally targeted by the Reddit traders. Silver is also down sharply on the day, erasing much of Monday’s gains.
Be sure to check out today’s Morning Lineup for updates on the latest market news and events, earnings reports from around the world, a discussion on the latest moves in the commodities markets, a recap of the latest in the COVID relief negotiations, an update on the latest national and international COVID trends, and much more.

Just as equities in the US bounced after the S&P 500 tested its 50-day moving average, European equities also bounced at two key levels of support yesterday. As shown in the chart, the rally of the last two days started just below the STOXX 600’s 50-day moving average and right at the prior highs of the consolidation range from December.

Daily Sector Snapshot — 2/1/21
Bespoke Market Calendar — February 2021
Please click the image below to view our February 2021 market calendar. This calendar includes the S&P 500’s average percentage change and average intraday chart pattern for each trading day during the upcoming month. It also includes market holidays and options expiration dates plus the dates of key economic indicator releases. Start a two-week free trial to one of Bespoke’s three research levels.

Shorting Silver
Whereas the focus of the investment world last week was on the most heavily shorted stocks, this week it has turned to the metals market as silver is having a tremendous day. In today’s Morning Lineup, we highlighted a few reasons why the squeeze in SLV is an entirely different animal than what was seen last week. Taking a further look at this, positioning this time around for silver looks quite different than it did for stocks like GME. Whereas GameStop (GME) had more shares short than exist in the market, silver positioning is actually net long. In the chart below, we show the speculator net positioning (as a percent of open interest) for silver as per Commitment of Traders data released on Friday which we also covered in Friday’s Closer. Net positioning (positive readings mean a net percentage of open interest is long and vice versa for negative readings) is in the 77th percentile of all weeks since 1986. That is also at the highest level since mid-February of last year. Prior to that, the last time speculator positioning was as long was in late November of 2017. In other words, at least for futures contracts, a retail pump of silver would be targeting a metal that speculator sentiment is already pretty positive on.

Additionally, in terms of the ETF tracking silver (SLV), short interest as a percentage of shares outstanding is by no means at any sort of extreme either. While the most recent bi-weekly data did show a sharp uptick in the first half of January, short interest as a percent of share outstanding is not at an elevated level. Pulling that data forward to today, 3.72% of shares outstanding are short. That is in the 60th percentile of all readings since 2006 when the ETF began trading. It’s also well off the peak of 11.75% in June of 2011. So again, if SLV was to be a target for a short squeeze like GME, there is not nearly the same base of shorts as we saw in GameStop (GME) and other stocks last week.

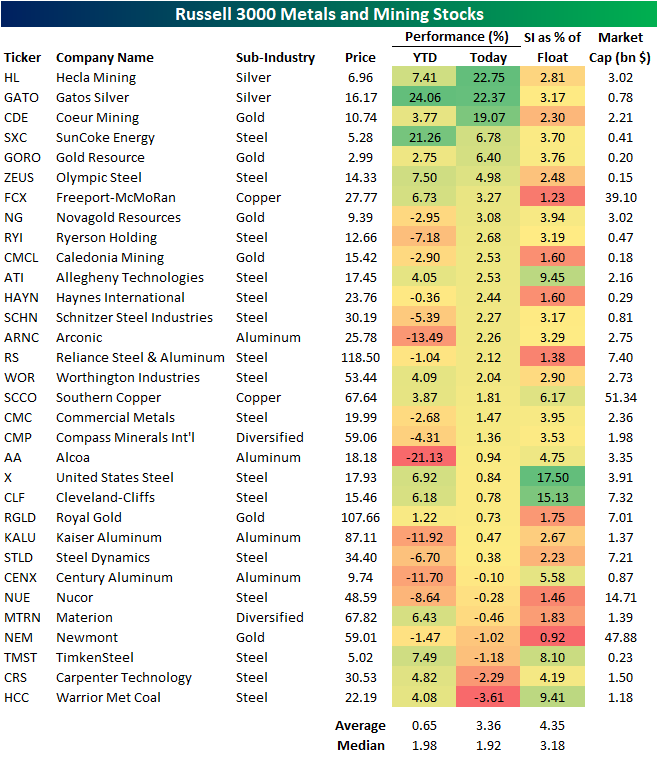
That also goes for individual mining stocks. In the table below, we show the Russell 3000 stocks that are part of the GICS Level 3 Mining and Metals industry. As shown, precious metal related names, especially those of the silver sub-industry, are flying higher today with Hecla Mining (HL) and Gatos Silver (GATO) both up over 20% as of this writing. Another silver mining giant, Coeur (CDE), is also up double digits today. Despite this, these do not have particularly high levels of short interest. In fact, steel makers like United States Steel (X), Cleveland Cliffs (CLF), and Allegheny Technologies (ATI) all boast far higher short interest as a percent of float. In other words, while silver and related stocks may be the target of retail investors this week, the “short squeeze” possibility is not the same as what was observed last week. Click here to view Bespoke’s premium membership options for our best research available.
Will Silver’s Luster Last?
Silver got off to a very strong start to February this morning as front-month futures traded up as much as 12.76% at the highs. Prices have since pulled back from those opening highs, but silver is still up around 7.5%. Another proxy for the metal, the Silver ETF (SLV) experienced a record opening gap of +11.04% this morning; the first time ever it gapped up more than 10%. The next largest gap up on record was a 7.76% gap in October of 2008. As shown in the charts below, front-month futures (based on settlement price) are now at their highest level since August 10th of last year, although earlier today it was even higher at its best level since 2013. Even after having pulled back intraday, silver futures are still on track to see a single day move in the top 1% of all days since 1975.

As of this writing, silver is up 7.4% on the day. In the table below, we show the past times since 1975 that silver was up at least 7% in a single day without another occurrence in the prior six months. The last such move was the equity market bottom of the bear market last year. Prior to that, you would have to go back to 2014 to find another time that silver experienced that large of a move. Across these past instances, performance has held a negative bias. Over the following weeks and months, median returns have been negative and silver has been higher less than half the time.Click here to view Bespoke’s premium membership options for our best research available.
