Sector Performance Disparities
What a week. Not just because the S&P 500 rebounded from last week’s dip to rally more than 4%, but also for the disparities in sector performance across different market caps.
The chart below shows sector performance for S&P 500 (large-cap) sectors this week. Leading the market higher this week, Energy led the way with a gain of 8.3%, followed by Communication Services (+7.3%), Financials (+6.6%), and Consumer Discretionary (+6.0%). At the other end of the spectrum, Health Care was the only sector that didn’t rally more than 1%.

While large-cap Health Care was the worst performing sector this week, a number of individual stocks in the sector had phenomenal weeks. The chart below shows the 25 top-performing Russell 3000 stocks this week. Of the 25 stocks listed, 17 come from the Health Care sector, including each of the top three and four of the top five!

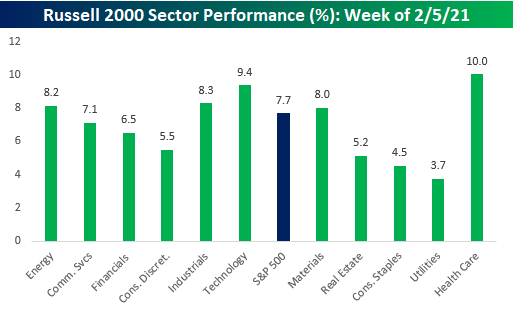
The chart below shows the performance of small cap sectors this week shown in the same order as the sectors above. While large-cap Health Care was the worst-performing sector of the week, in the small-cap space, Health Care was the top-performing sector! Health Care had the largest disparity in terms of sector performance between large and small caps, other sectors that saw pretty sizable disparities were Technology, which barely outperformed in the large cap space but was the second best performing sector in the small cap space, Materials, and Industrials. It’s typically common for sector perofrmance to be similar across the market cap spectrum, but this week certainly proved to be an exception. Click here to view Bespoke’s premium membership options for our best research available.
Super Bowl LV: Time to Break the Tie – Go Bucs!
This year’s Super Bowl will be a first for many different reasons. It will be the first-ever game played in the home stadium of one of the teams playing. It will be the first-ever game with a 43-year-old starting QB. The age difference between the starting QBs will be the widest ever (18+ years). The game will not be played to a full stadium (attendance capped at 25K). We could go on. Another interesting aspect of this year’s game is that it will break the tie between the AFC and NFC for the number of championships won (27). The last time the two conferences had an equal number of Super Bowl titles was back in 1990 after Super Bowl XXIV when each conference had 12. The New York Giants broke that tie in 1991 when Scott Norwood went ‘wide ride’ to give the NFC its 7th straight and 13th total Super Bowl victory. From there, the NFC continued its domination of the AFC (and the Bills) winning the next six championship games, including three against the Bills.

We’ve all heard of the Super Bowl market indicator which says that a win for the NFC bodes well for the equity market while an AFC victory is a bearish signal. For years, there actually was a wide gap in performance for the market following wins by either conference in the past, but in recent years the disparity has narrowed. In the 27 years where the AFC has won the Super Bowl, the S&P 500 averaged a rest of year gain of 6.9% with positive returns 70% of the time. When the NFC wins, though, the S&P 500’s average rest of year performance has been a gain of 10.5% with positive returns more than 77% of the time.

When it comes to individual teams, 13 have won the Super Bowl more than once. The two teams with the most victories are the Steelers and Patriots each of which has won the game six times. The Dallas Cowboys often refer to themselves as ‘America’s Team’ but Pittsburgh is the “Stock Market’s Team”. In the six years where the Steelers won the Super Bowl, the S&P 500 experienced positive returns for the remainder of the year every time for an average gain of 18.8%! Market returns for the Patriots following their six victories have been a much more muted 4.6%, including a decline of more than 21% from the end of the team’s first victory in 2002. The 49ers and the Broncos have ‘only’ won five and three Super Bowls, respectively, but following their victories, the S&P 500 has been up for the remainder of the year every time for an average gain of more than 20%!
So, what about this year’s teams? The Chiefs have won the Super Bowl twice in their history, and the S&P 500 has averaged a rest of year gain of 8.1% following their victories. While the S&P 500 was down for the remainder of the year after they won in 1970, the decline was less than 1%. The one year the Chiefs made it to the championship but lost, the S&P 500 was up over 14% for the remainder of the year.
For the NFC, Tampa Bay’s one and only appearance in the Super Bowl was in 2003 (XXXVII). They won that game, and the S&P 500’s rest of the year gain was over 29%. Additionally, while they’re on a new team now, in the three Patriots victories where Tom Brady and Rob Gronkowski were both on the team, the S&P 500 was higher for the remainder of the year all three times for an average gain of 12.7%. Go Bucs! Click here to view Bespoke’s premium membership options for our best research available.

Bespoke’s Morning Lineup – 2/5/21 – Jobs Day
See what’s driving market performance around the world in today’s Morning Lineup. Bespoke’s Morning Lineup is the best way to start your trading day. Read it now by starting a two-week free trial to Bespoke Premium. CLICK HERE to learn more and start your free trial.
“Gambling, beer and football filled the horizons of their minds.” – George Orwell
It may be Super Bowl weekend, but most people looking to enjoy a couple of beers watching the game this year will be following the lead of George Thorogood and drinking those beers alone- or at least with nothing more than a small group! Before we get to thinking about Sunday’s game, though, we still have the last trading day of the week to get through, and what a week it has been. The S&P 500 is up over 4% and on pace for its best week since the Election.
The January Non-Farm Payrolls report was just released and the results were mixed. While total Non-Farm Payrolls rose less than expected (49K vs 105K), the Unemployment Rate fell to 6.3% versus expectations for 6.7%. Average hourly earnings were slightly weaker than expected at 0.2% on a month over month basis, but because of revisions showed a larger than expected y/y increase. The average workweek spiked up to 35 hours which is a level that hasn’t been seen in years. Despite millions of jobs lost since the start of the pandemic, Americans who are working are working more and earnings more than they have in years.
Be sure to check out today’s Morning Lineup for updates on the latest market news and events, earnings reports from around the world, economic data out of South Korea and Europe, an update on the latest national and international COVID trends, and much more.

What a difference a week makes. In last week’s Bespoke Report and our B.I.G. Tips report from Sunday evening, we noted that after the declines from the prior week, major US index and sector ETFs had sen their timing scores in our Trend Analyzer shift from mostly ‘Poor’ to ‘Good’. Below is a snapshot of where things stood for US indices through last Friday’s close. Over the trailing five trading days, every index ETF was down, but with the exception of the Micro-Cap ETF (IWC), every ETF had a ‘Good’ timing score.

After the gains of the last four trading days, the picture has changed a lot. Over the last five trading days, every ETF in the Trend Analyzer was up over 1% and most are up well over 2%. With these gains, all of the ETFs have now moved back into overbought territory, and all of the timing scores have now shifted to ‘Neutral’ or ‘Poor’. That doesn’t mean that the market will necessarily pull back from here, but the risk/reward is skewed more towards the risk side again. As always, pick your spots.

The Bespoke 50 Top Growth Stocks — 2/4/21
Every Thursday, Bespoke publishes its “Bespoke 50” list of top growth stocks in the Russell 3,000. Our “Bespoke 50” portfolio is made up of the 50 stocks that fit a proprietary growth screen that we created a number of years ago. Since inception in early 2012, the “Bespoke 50” is up 472.7% excluding dividends, commissions, or fees. Over the same period, the S&P 500 is up in price by 180.4%. Always remember, though, that past performance is no guarantee of future returns. To view our “Bespoke 50” list of top growth stocks, please start a two-week free trial to either Bespoke Premium or Bespoke Institutional.

Bespoke’s Weekly Sector Snapshot — 2/4/21
January 2021 Headlines
Chart of the Day: Meme Stocks Are Night & Day
B.I.G. Tips – No Love for Earnings Beats
Over a Quarter Eying a Correction
In spite of the continued craziness in the headlines over the past week, sentiment has seen little in the way of change. AAII‘s weekly sentiment survey saw bullish sentiment fall just 0.3 percentage points to 37.4%. That is a third consecutive decline and leaves bullish sentiment at the lowest level since the end of October.

Bearish sentiment was also lower this week dropping to 35.6% compared to last week’s reading of 38.3% which was the highest level since early October. That leaves bearish sentiment right in the middle of the range of the past year, still several percentage points below last year’s elevated levels and the more recent historically low readings.

The bigger decline in bearish sentiment relative to the move in bullish sentiment resulted in the bull-bear spread to move back into positive territory after briefly dipping to -0.6 last week; the first negative reading since mid-October.

Neutral sentiment picked up the losses rising to 27.1% from 24% last week. That 3.1 percentage point week over week increase only brings neutral sentiment back to similar levels to the end of 2020.

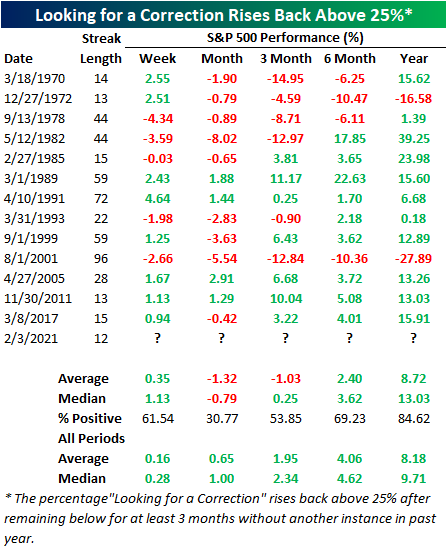
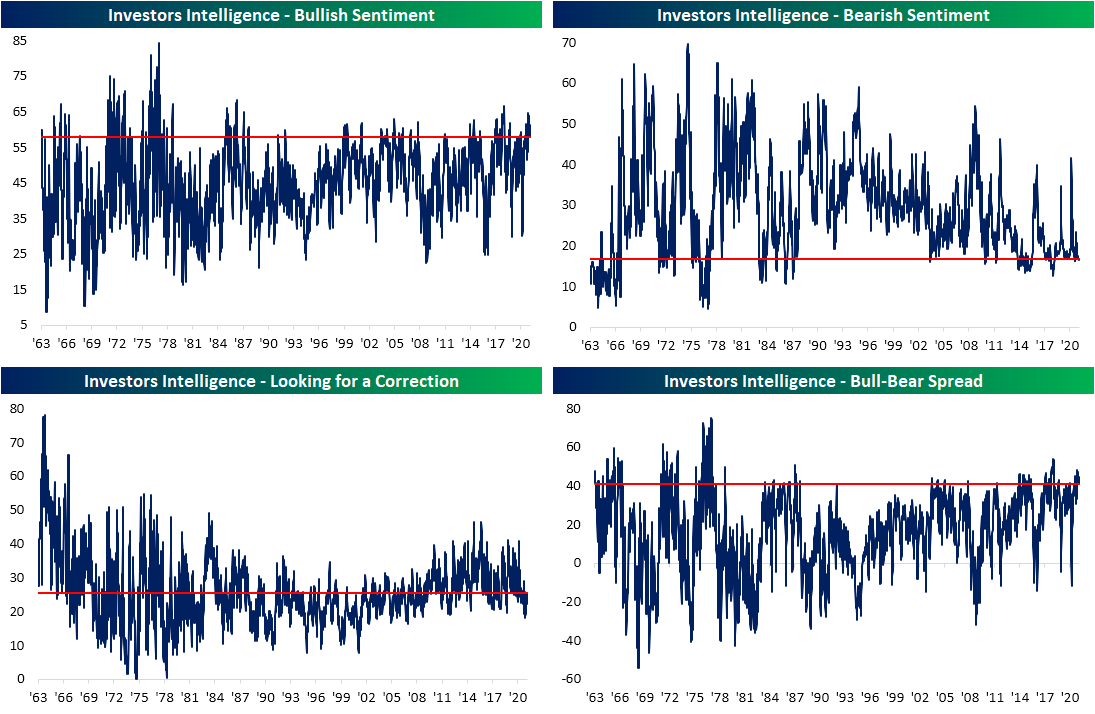
In another sentiment survey from Investor’s Intelligence, which surveys newsletter writers rather than individual investors, the readings were similar. Bullish sentiment in this survey also came in at some of the lowest levels since the fall. At 57.8%, it was the first sub-60% reading since mid-November and the lowest reading since November 4th. Bearish sentiment was slightly higher rising to 16.7% from 16.5% though it is still below levels from two weeks ago. While these survey results still lean historically bullish with the bull-bear spread at 41.1—which is in the top decline of readings going back to the 1960s—a higher share of respondents did report that they are looking for a correction. That reading climbed above 25% for the first time since the first week of November. While that is far from a historically high reading (historical average of 25.77%), it did end a streak of consecutive readings below 25% at 12 weeks long.
Across the history of the survey, there have been 42 streaks of readings of “looking for a correction” below 25% that lasted for at least 12 consecutive weeks. In the table below, we show the 14 of these instances that occurred without a prior occurrence in the past year. These streaks coming to an end have typically pointed to some short term weakness with the next month and 3 month periods averaging a decline. For the one month period, returns have only been positive 30.77% of the time. Six months later performance has leaned positive but underperforms the norm. On the bright side, one year after these streaks come to an end performance has much more consistently been positive with slightly above-average returns. Click here to view Bespoke’s premium membership options for our best research available.