Bespoke’s Morning Lineup – 3/18/21 – On Second Thought
See what’s driving market performance around the world in today’s Morning Lineup. Bespoke’s Morning Lineup is the best way to start your trading day. Read it now by starting a two-week free trial to Bespoke Premium. CLICK HERE to learn more and start your free trial.
“Faced with the choice between changing one’s mind and proving that there is no need to do so, almost everyone gets busy on the proof.” – John Kenneth Galbraith
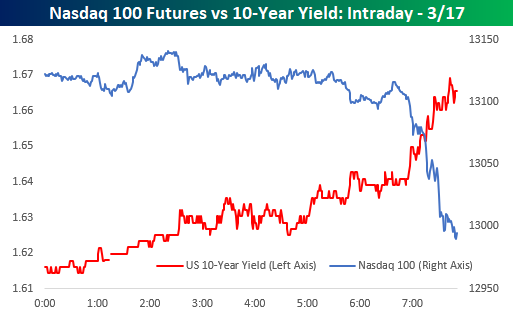
After yesterday’s FOMC rate decision and Powell press conference, investors appeared to be comfortable with the Fed’s plan going forward. That sent treasury yields lower and equity futures higher. After sleeping on it, though, investors are having second thoughts. This morning equity futures are in the red with the Nasdaq especially feeling the pain, and Treasury yields are surging. In fact, Nasdaq 100 futures are currently well over 1% lower and threatening to take out their lows from Wednesday morning.
Economic data today was relatively busy with Jobless Claims and the Philly Fed just coming out and Leading Indicators scheduled to come out at 10:00 AM. Initial and Continuing Claims both missed expectations coming in higher than expected. Philly Fed was an enormous beat relative to expectations with the headline reading coming in at 51.8 and one of its highest readings ever and the best since 1973. Prices Paid was also extremely elevated, though, so that won’t help quell concerns over inflation.
Be sure to check out today’s Morning Lineup for updates on the latest market news and events, an update on economic data out of Asia and Europe, a recap of all the major central bank announcements since the close yesterday (there were a lot!), the latest US and international COVID trends including our series of charts tracking vaccinations, and much more.

The chart below encapsulates the drama in markets that surrounded the FOMC meeting. Yesterday, yields were sharply higher ahead of the meeting and started to come back in leading up to and after the announcement. Overnight, though, the rally in Treasuries and drop in yields subsided, and this morning, no one wants anything to do with US Treasuries as the 10-year yield has risen well above yesterday’s high and 1.7% to its highest levels since January of last year.

Daily Sector Snapshot — 3/17/21
Gas Prices Accelerating
Along with just about everything else these days, prices at the pump have been surging this year. According to AAA, the national average price of a gallon of gas currently stands at $2.88 per gallon. To find the last time prices were this high, you have to go back to May 2019. This year alone, gas prices have already increased 27.7%. The table below compares the change in gas prices so far this year to the same time period in every other year since 2005, while the chart compares the trend in prices this year to a composite pattern of all other years. At the current price level, gas prices are the highest they have been at this point in the year since 2014, and there have only been five other years where prices were higher.
What really stands out, though, is how fast prices have increased. Prior to 2021, there wasn’t a single year since 2005 that the national average price increased by more than 20% YTD through 3/17, but this year, they’re already up 27.7%! Based on the typical seasonal pattern, don’t expect much in the way of relief anytime soon. Typically, prices at the pump rise right up through Memorial Day and then level off for the summer before easing in the last four months of the year.

The recent rise in gasoline prices has also been incredibly consistent. It has now been 52 straight days that the national average price has gone without a one-day decline and represents just the fourth streak of 50 or more days since 2005. The longest streak ended at 76 days in early 2019 (the last time prices approached $3 per gallon) while the only two other streaks were in 2007 and 2009.

With the early stages of the COVID outbreak now a year in the rearview mirror, we’re starting to see some crazy y/y moves in gas prices and these moves are only going to get more extreme as we approach the one-year anniversary of crude oil prices going negative. The average price of a gallon of gas is up 28.3% versus a year ago which is already the highest y/y pace in four years. In the weeks ahead, though, this y/y rate is almost guaranteed to increase. As mentioned above, gas prices typically rise between now and the end of April, and in the 16 years since 2005, there have only been three years where prices declined between now and 4/30. Not only that, but during the period from 3/17 through 4/30 last year, gas prices decline more than 20%. Therefore, even if prices stay flat between now and 4/30, the y/y increase will surge to 62.8%, which would be just shy of a record y/y pace. The FOMC may be pulling out all the stops to get inflation higher, but unless you own a gas station, these trends in gas prices are painful. Start a two-week free trial to Bespoke Institutional for full access to all of our research and market commentary.
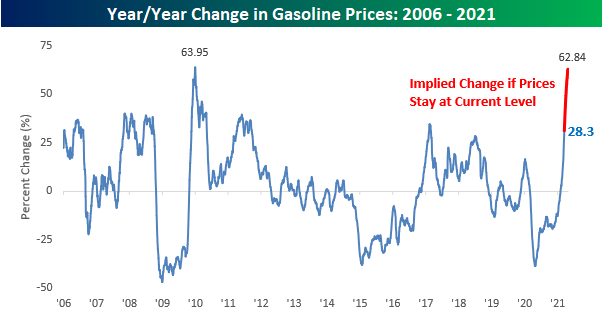
Chart of the Day: Long Term Treasury Bear Markets
B.I.G. Tips – The Big Shift
Bespoke’s Morning Lineup – 3/17/21 – Walking the Tightrope
See what’s driving market performance around the world in today’s Morning Lineup. Bespoke’s Morning Lineup is the best way to start your trading day. Read it now by starting a two-week free trial to Bespoke Premium. CLICK HERE to learn more and start your free trial.
PELLEY: Fair to say you simply flooded the system with money?
POWELL: Yes. We did.
Ten months ago, Fed Chair Jay Powell appeared on 60 Minutes to explain the Federal Reserve’s unprecedented response to the COVID pandemic and assure Americans that the Fed would be there at the ready to provide whatever financial support the economy needed. As the exchange between Pelley and Powell above indicates, Powell was pretty blunt in his explanation. Today, market participants eagerly await the Fed Chair’s explanation for how the Committee plans to proceed now that the US appears to be coming out from the other side of the pandemic. It’s much easier to throw money at a problem than it is to take that money back when the problem starts to go away, so it’s pretty safe to assume that the Fed Chair will be a lot more nuanced with his comments today than he was last May.
It may be St Patrick’s Day, but there’s not a lot of green on the screens today as US equity futures (especially the Nasdaq), commodities, Treasuries, and even bitcoin are all mostly flat to lower on the day. Housing Starts and Building Permits were just released, and following yesterday’s weaker than expected homebuilder sentiment report for March, these reports (based on February data) both came in significantly weaker than expected. Despite the miss, though, US Treasury yields haven’t pulled back, so there’s been no relief for the Nasdaq.
Be sure to check out today’s Morning Lineup for updates on the latest market news and events, an update on economic data out of Asia and Europe, the latest US and international COVID trends including our series of charts tracking vaccinations, and much more.
To say the balancing act the FOMC finds itself in is delicate would be an understatement. An intraday chart of the 10-Year US Treasury Yield versus Nasdaq 100 futures provides an excellent example. Just after 6 AM eastern treasury yields spiked higher and the pavlovian response in the equity futures markets was to hit the bids sending futures sharply lower. Powell sure has his work cut out for him this afternoon!
Daily Sector Snapshot — 3/16/21
Bespoke Stock Scores — 3/16/21
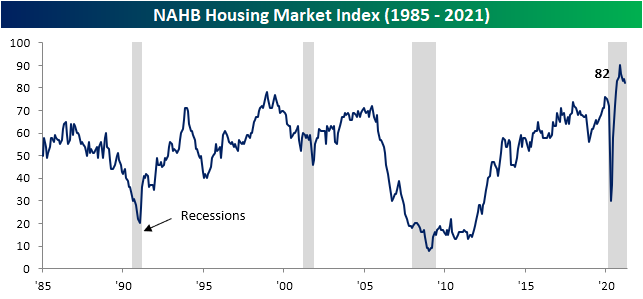
Sentiment Holding Back Homebuilders
The National Association of Home Builder’s measure of homebuilder sentiment fell again in March. Although the index’s 2 point decline down to 82 leaves it 8 points off the November record high, the current level of sentiment is still a few points above the pre-pandemic record high.
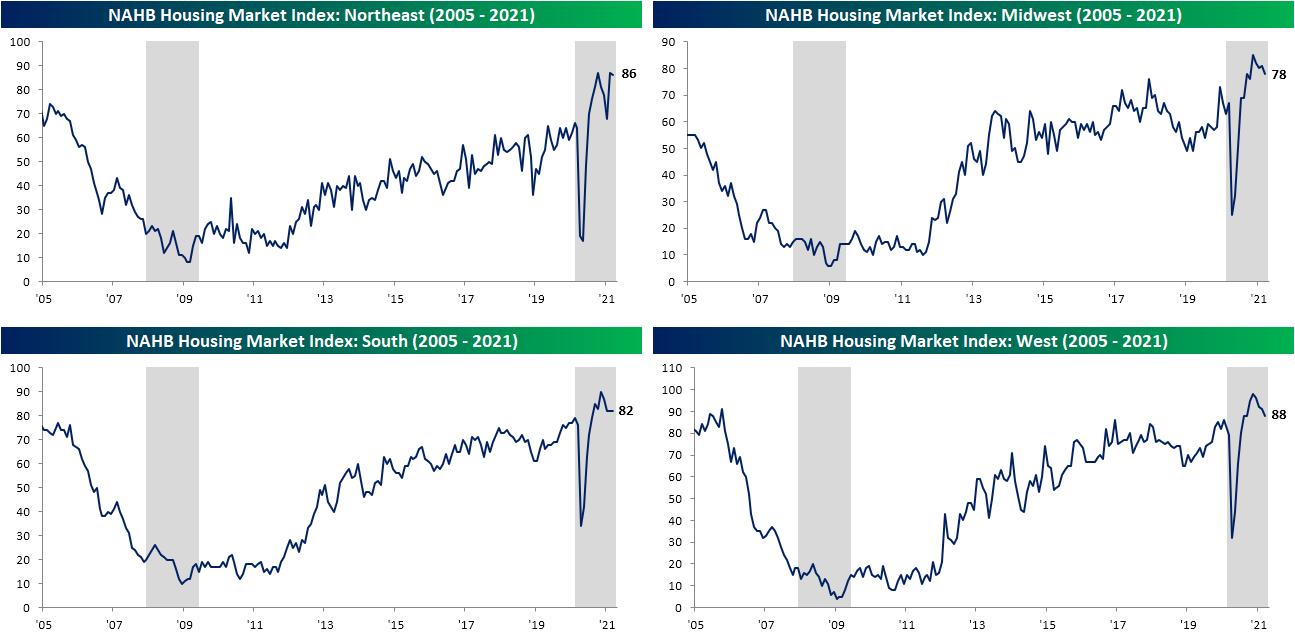
A decline in present sales drove that decline as the index fell 3 points from 90 to 87. As with the headline number, although that is a decline from the peak of 96 in November, the current reading is still above anything recorded prior to the pandemic. Additionally, considering the indices for Future Sales and Traffic have held up better, that decline in Present Sales does not necessarily point to a broader downturn in demand. Even though Present Sales were lower, the index for Future Sales rose by 3 points recovering the ground lost in February while Buyer Traffic also avoided a decline as that index went unchanged from February. Again rather than a broader deterioration of conditions, the decline in Present Sales could be a result of issues like rising prices of things like lumber and higher mortgage rates which in turn means overall higher costs of a new home.

The South was the only region to avoid a decline in March. That index held steady at 82 for the third month in a row. The Northeast also fared a bit better than the other regions as the index only fell one point from last month’s level that was tied with October for a record high. The Midwest and the West fell more sharply with each index dropping 3 points. Regardless of those declines, both indices continue to come in at historically strong levels.
With the weaker headline release providing a bit of a headwind in terms of catalysts, the iShares Home Construction ETF (ITB) is fighting to break out and hold above its early February highs today. Last week it unsuccessfully tried to take out resistance, but still remains right below its prior highs.
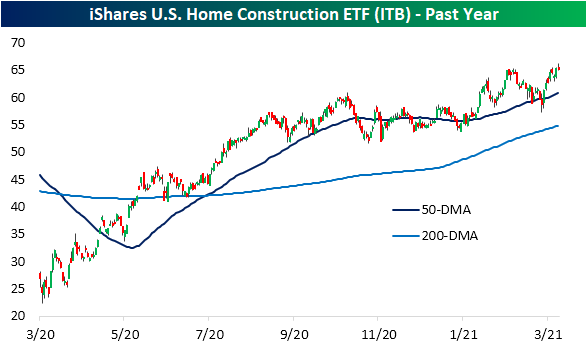
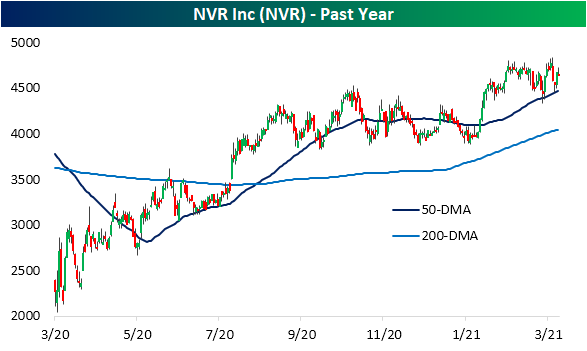
Looking across S&P 1500 homebuilder stocks, there are two in our Trend Analyzer tool that currently earn “good” timing scores: TopBuild (BLD) and NVR (NVR). Whereas the broader group is testing 52-week highs, BLD and NVR are some of the few that are not currently overbought having recently pulled back a bit. After taking a brief dip below its 50-DMA late last month, BLD has been fluctuating around its moving average over the past few days. NVR on the other hand was unsuccessful in breaking out last week which was followed by a successful bounce off of its 50-DMA yesterday. Start a two-week free trial to Bespoke Institutional to access our interactive economic indicators monitor and much more.

B.I.G. Tips – Retail Sales Whiplash
Viewed in isolation, the February Retail Sales report was terrible. With headline sales falling 3% on a month/month basis, it was the fifth-worst headline print in the history of the report going back to 1992. The only months that were worse were two in 2008 and two in 2020. Aren’t we supposed to be on our way out of the crisis?

In our just-released B.I.G. Tips report, we broke out the details of the February report including its bright and dark spots. For anyone with more than a passing interest in how the COVID outbreak is impacting the economy, our monthly update on retail sales is a must-read. To see the report, sign up for a monthly Bespoke Premium membership now!