Triple Plays Waking Up With Good Breadth
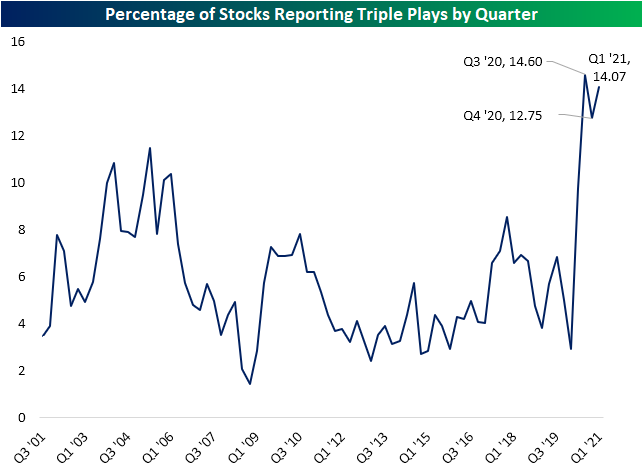
Since March 1st, three-quarters of companies have beaten consensus analyst estimates on the top and bottom line, while 16% have raised guidance. Given this, the number of stocks reporting a triple play—EPS and sales beat alongside raised guidance—has been back on the rise. In the chart below we show the percentage of stocks reporting triple plays by quarter throughout the history of our earnings database dating back to 2001. With strong beat rates over the past year, the rate of triple plays has ripped higher to unprecedented levels. After a slight dip during the Q4 2020 reporting period, 14.1% of all earnings reports have been triple plays since March 1st. That’s almost as high as the record reading of 14.6% seen during the Q3 2020 period.
One interesting aspect of earnings over the past year has been stock price reactions. Perhaps due to a higher number of companies doing so, a company exceeding sales or EPS estimates or reporting a triple play has lost some of its luster. Particularly for triple plays, historically these stocks have averaged a 5.22% rally on their first full trading day after earnings. (For stocks that report after the close, we’re referencing its change on the next trading day. For stocks that report before the open, we’re referencing its change on that trading day.) In the two earnings seasons prior to the current one, the average full-day stock price reaction was not even half of that. So far this earnings season, average reactions for triple plays remain well below the historic average, but they are improving. Triple plays have averaged a 4.68% gain on Q1 earnings this year. Reactions to earnings more broadly have seen the same dynamic play out. Reactions in aggregate have been on the weak side but are recovering.

Not only have there been a higher number of triple plays with improving stock price reactions to boot, but the composition of the stocks reporting triple plays has also been changing. In the charts below we show the percentage of stocks reporting triple plays by sector going back to 2001. Historically, the Tech sector has dominated triple plays. Going back to 2001, the average quarter would see 11.63% of the sector’s stocks report a triple play. No other sector even touches double digits with the runner-up being Health Care with 7.33%.
While there are still plenty of earnings reports left on the docket this season, the reading at the moment for the Tech sector is at 23.93%. Although that is still extremely strong, more than double the historical average, it is lower for the second quarter in a row. Meanwhile, other sectors are seeing their shares of stocks reporting triple plays surge. For example, Industrials, Consumer Discretionary, and Materials currently all have a record percentage of stocks reporting triple plays. Though not at records, Communication Services and Real Estate also have very high readings. When it comes to triple plays, the numbers are really expanding to sectors outside of Tech. Click here to view Bespoke’s premium membership options for our best research available.

Chart of the Day – Biden Nears the Top of List
Bespoke’s Morning Lineup – 4/28/21 – Yields Creeping Higher
See what’s driving market performance around the world in today’s Morning Lineup. Bespoke’s Morning Lineup is the best way to start your trading day. Read it now by starting a two-week free trial to Bespoke Premium. CLICK HERE to learn more and start your free trial.
“I believe that if you show people the problems and you show them the solutions they will be moved to act.” – Bill Gates
Despite another round of blowout earnings since yesterday’s close, futures are flat to modestly lower. The economic calendar is light again today, but the pace of earnings will continue to be busy, and this afternoon, all eyes will be on the FOMC with its latest views on rates and the economy.
Read today’s Morning Lineup for a recap of all the major market news and events including the biggest overnight events, some key earnings reports, economic data from around the world, as well as the latest US and international COVID trends including our vaccination trackers, and much more.

Concerns over interest rates have taken a back seat lately, mostly because yields have been moving lower for the last several weeks. In recent days, though, we have started to see a modest reversal of that trend. Just as the yield on the 10-year US Treasury tested its 50-DMA, yields have started to move higher in recent days. This morning, yields are ticking slightly higher, and that has resulted in an upside break of the short-term downtrend from the peak yield in March. With an FOMC announcement and press conference coming up later today, it’s pretty safe to assume that yields are going to start getting a bit more attention.

Daily Sector Snapshot — 4/27/21
Chart of the Day: 20-Year Rolling Performance
Soaring Home Prices
We got yet another data point on surging home prices today with the monthly release of Case Shiller indices. These numbers are lagged by two months so they don’t exactly provide a real-time look, but at least through February, home prices continue to soar. The table below shows month-over-month and year-over-year home price moves across the 20 cities tracked by the Case Shiller indices. The west has seen a big jump lately with San Diego, Seattle, San Francisco, and Phoenix all rising more than 2% month-over-month. Chicago and New York saw prices rise the least MoM at just 0.30% and 0.55%, respectively.
Nearly every city is up double-digit percentage points year-over-year. Phoenix and San Diego are up the most YoY with gains of ~17%, while Chicago is up the least with a gain of 8.71%. Click here to view Bespoke’s premium membership options for our best research available.

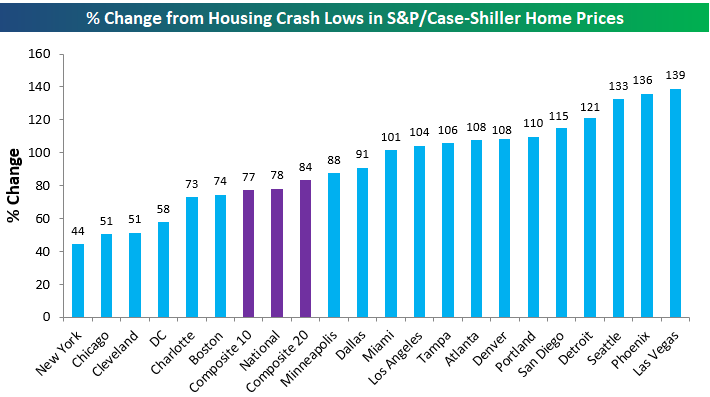
We like to look at home price trends relative to where they stood at various points during the mid-2000s housing bubble and subsequent crash. The chart below looks at where home prices stand now versus the lows that were made in the early 2010s after the bubble burst. As shown, the national index is now up 78% from its housing crash low, and eleven of twenty cities are up more than 100% from their lows. Las Vegas, Phoenix, and Seattle are up the most with gains of more than 130%, while New York is up the least and the only city that’s not up more than 50%.
The better chart is the one that looks at where home prices are now relative to their high points at the peak of the prior housing bubble. We’re now more than fifteen years removed from the prior peak for home prices in 2005/2006, and at this point only three of the twenty cities tracked have not made new all-time highs. Those three cities are are Las Vegas, Chicago, and Miami. Miami is the one closest to making new highs at just 2%, while Las Vegas prices are still 9% below their highs made in August 2006. The composite indices and the seventeen other cities have all managed to take out their housing bubble highs. Denver, Dallas, and Seattle are all up more than 50% above their prior all-time highs.

Below are price charts for all of the cities and composite indices tracked by Case Shiller. Cities not highlighted in green are the ones still below their prior housing bubble highs.


Bespoke Stock Scores — 4/27/21
B.I.G Tips – Sentiment on the Rise
Solar and Steel Shining, Biotech Bounces, and Miners Moving
Looking across the ETFs in the US Groups screen of our Trend Analyzer, by far the best performer over the past week has been the Solar ETF (TAN). In just five days, TAN has managed to rally 11% roughly cutting in half what had been a 20% YTD decline through last week. Even after that rally though, after stellar returns last year, TAN is still the worst performer of this group of ETFs in 2021. Given it had traded in oversold territory for most of the past two months, TAN’s recent rally has not even been enough to bring the ETF back above its 50-DMA. TAN is not alone in being an ETF to see rotation in the past week after YTD weakness though. For example, biotech ETFs like the S&P Biotech ETF (XBI) and Nasdaq Biotechnology ETF (IBB) have both been strong over the last week after underperforming YTD,
Not all YTD losers have seen outsized gains in recent trading though. Both gold miner ETFs – GDX and GDXJ – are down YTD but have only seen marginal gains over the last week.
The Steel ETF (SLX) has also gone on an impressive run in the last week as the fourth best performing ETF in the screen. That has helped make it one of the strongest YTD performers putting it into extreme overbought territory as it trades 13% above its 50-DMA.

Some of these recent moves have resulted in some interesting developments in the various charts of these same ETFs which we show in the snapshot of our Chart Scanner below. Circling back to the gold miners, GDX has been in rally mode over the past couple of months resulting in it moving back above its 50-DMA and breaking its downtrend in the process. That does not mean GDX is totally out of the woods. So far the ETF has come up short of its 200-DMA which will be an interesting area of resistance to watch going forward. Similarly, after erasing some of the huge run in 2020, TAN (bottom left) managed to find support around $81 at multiple points in the past several weeks with the most recent test of this level being exactly a week ago. The huge 11% rally in the days since has brought it back up to its 50-DMA which it so far has failed to move back above. Conversely, IBB had been stuck between both its 50 and 200-DMAs since late February, but the recent bounce off of its 200-DMA preceded a breakthrough of its 50-day to the upside that has taken place over the past few days.
As for the other ETFs in our US Groups screen, there are multiple ones like the North American Tech-Multimedia Networking ETF (IGN), Semiconductors (SMH), and Regional Banking ETF (KRE) that have been rallying off of their 50-DMAs and moving back up towards 52-week highs. In the case of IGN, that has resulted in what appears to be an upside break of the past few months’ wedge pattern. There are also other breakouts to new 52-week highs like for the US Financial Services ETF (IYG) and the S&P Metals and Mining ETF (XME). Click here to view Bespoke’s premium membership options for our best research available.

Bespoke’s Morning Lineup – 4/27/21 – Earnings Remain Strong
See what’s driving market performance around the world in today’s Morning Lineup. Bespoke’s Morning Lineup is the best way to start your trading day. Read it now by starting a two-week free trial to Bespoke Premium. CLICK HERE to learn more and start your free trial.
“When Henry Ford made cheap, reliable cars people said, ‘Nah, what’s wrong with a horse?’ That was a huge bet he made, and it worked.” – Elon Musk
The pace of earnings reports has picked up steam considerably, but the pace of earnings beats has remained strong so far. This morning, nearly 80% of companies reporting have topped EPS forecasts and more than 70% have topped revenue forecasts. All in all, a strong showing. We’re also even seeing a number of positive price reactions to the companies reporting with UPS being a notable winner in early trading.
Read today’s Morning Lineup for a recap of all the major market news and events including the biggest overnight events, some key earnings reports, economic data from around the world, as well as the latest US and international COVID trends including our vaccination trackers, and much more.
The S&P 500 hit an all-time high yesterday, and overall breadth has remained positive. One example we wanted to highlight this morning is the fact that of the 62 industries within the S&P 500, 49 (79%) are within 5% of a 52-week high, and 21 (34%) are within 1% of a high. That leaves just 13 industries (21%), which are highlighted in the chart below, down more than 5% from their respective 52-week highs. Leading the way to the downside, Energy Equipment is down nearly 17% after its blistering rally late last year and early this year while the Autos group is down just over 14%. Another notable industry in the group is Technology Hardware, which is basically a proxy for Apple (AAPL). That’s the only industry from the Technology sector in the group that is down over 5%, but we did find it interesting that two other industries with the word ‘technology’ in them are also included- Biotechnology (-5.02%) and Health Care Technology (-10.2%).
