Bespoke’s Morning Lineup – 3/31/21 – The Homestretch For Q1
See what’s driving market performance around the world in today’s Morning Lineup. Bespoke’s Morning Lineup is the best way to start your trading day. Read it now by starting a two-week free trial to Bespoke Premium. CLICK HERE to learn more and start your free trial.
“End? No, the journey doesn’t end here.” – J.R.R. Tolkien
The first quarter is nearly in the books, but the year has only just begun, and with GameStop and Archegos already, it doesn’t look like 2021 will be a snoozer. Futures are inching higher this morning with the Nasdaq leading the way higher.
Economic data has generally been positive overnight with Chinese PMI and South Korean Industrial Production topping expectations, while inflation data in Europe remains relatively tame.
Read today’s Morning Lineup for a recap of all the major market news and events including a discussion of quarter-end trends, events in Brazil, a recap of international markets, the latest US and international COVID trends including our series of charts tracking vaccinations, and much more.

For all the churning in the market lately, it sounds hard to believe that every sector in the S&P 500 is on pace to finish Q1 in the black for the year. Granted, the gains aren’t evenly distributed, but it’s still impressive to see every sector positive on the year. Leading the way higher, Energy’s (XLE) 31% surge tops the list, but the double-digit percentage gains from Financials (XLF) and Industrials (XLI) are nothing to scoff at. Defensive-oriented sectors are unsurprisingly at the bottom of the list as Health Care (XLV), Utilities (XLU), and Consumer Staples (XLP) are all up 3% or less.
The most surprising sector to some, though, is Technology (XLK) which is at the absolute bottom of the list and just barely hanging on to positive territory for the year with a gain of under 1%. XLK is the only sector below its 50-DMA, and while it’s indicated to open higher today, closing out the quarter above its 50-DMA is going to be tough.

Daily Sector Snapshot — 3/30/21
E.W. Scripps (SSP) Diverging From the Script of Media & Entertainment Stocks
Major media stocks caught up in the Archego margin call have found some respite today as Discovery (DISCA) and ViacomCBS (VIAC) both trade higher. Elsewhere in the Media and Entertainment industry, E.W. Scripps (SSP) came in at the top of our Stock Scores this week. Our Stock Scores ranks members of the S&P 1500 on their attractiveness based on a range of Fundamental, Technical, and Sentiment indicators. For access to our weekly Stock Scores screen, sign up here for access. SSP—which has a portfolio of local and national media outlets like TV stations and newspapers—came in this week with a perfect Technical score alongside high Fundamental and Sentiment scores.
At its multi-year highs earlier this month, E.W. Scripps (SSP) had broken out to multi-year highs before its sharp pullback in the second half of March which has brought the stock down around 20% from its closing high on March 12th. While that decline coincides with the big losses in VIAC and DISCA that resulted from prime brokers, who held positions equal to more than 5% of each company’s float, selling positions as hedge fund clients failed to meet margin calls on swap positions, in the case of SSP none of those same brokers like Credit Suisse or Morgan Stanley possess any significant stake. Additionally, the technical damage has not been quite as severe for SSP. Whereas the losses for VIAC or DISCA resulted in the stocks crashing through their 50-DMAs, SSP’s uptrend remains intact as it has so far managed to find support at its 50-DMA in the past week. SSP didn’t rally nearly as much as DISCA or VIAC, they haven’t dropped nearly as much either.

Not only is the technical picture positive, but an attractive valuation relative to its peers also played into EW Scripps’ high Stock Score this week. SSP showed much stronger revenue growth YoY, up 37.45% in 2020, when compared to the average for other stocks in the Media and Entertainment Industry. On top of that stronger revenue growth, SSP trades at a discount to the average stock in its industry on a forward P/E, P/S, and EV/EBITDA basis. Those are also more attractive valuations than VIAC and DISCA in spite of both of those stocks having seen their prices nearly cut in half recently. Respective of its own history, current valuations for SSP are also at the low end of the past decade’s range. Click here to view Bespoke’s premium membership options for our best research available.
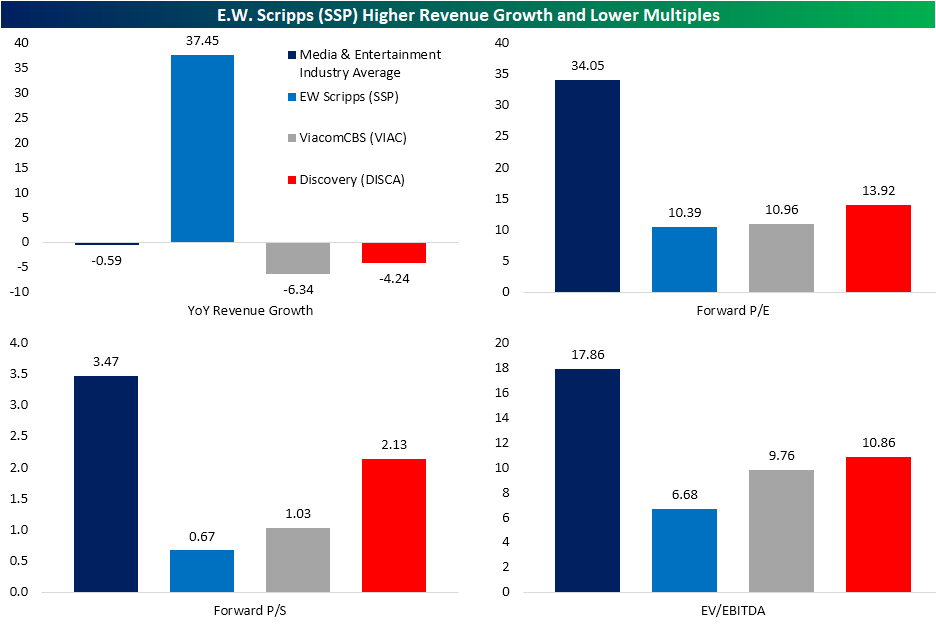
Chart of the Day – Consumer Confidence Finally Shows Up
Bespoke Stock Scores — 3/30/21
Bank and Broker CDS After Archegos
On Friday, we noted massive share price declines for a handful of US media names and Chinese education technology stocks. Further details of the saga were released over the weekend and into this week which we reviewed in greater detail in yesterday’s Morning Lineup. Included in that news were announcements that two of the prime brokers for Archegos Capital Management — Credit Suisse (CS) and Nomura Holdings (NMR) — could incur significant losses as a result of the liquidation event. As a result, the two stocks were down double-digit percentage points yesterday with further losses today.
Some US firms have also been reported as involved as prime brokers in the ordeal including Morgan Stanley (MS) and Goldman Sachs (GS). In spite of their involvement, credit default swap (CDS) spreads have risen recently but are not necessarily at worrying levels for the time being. As shown in the charts below, the only major US investment banks’ CDS spread that has reached a new six-month high has been Morgan Stanley (MS). Across these four banks, CDS spreads range from Bank of America’s (BAC) low of 52.49 bps to Goldman Sachs’ (GS) high of 63.9 bps.

From an even longer time horizon, the recent tick higher in CDS is hardly even noticeable, especially relative to where they stood exactly one year ago. Back then, other than GS, each of these CDS spreads peaked above 200 bps. Again, although they have begun trending slightly higher, current levels across these four names are all below the five-year average.

By far the biggest move in CDS has been for the bank that appears to be the most affected: Credit Suisse. As shown in the first chart below, CDS for Credit Suisse have spiked to new six-month highs. Even still, CDS are only trading just above 70 basis points, which is significantly lower than the reading in the mid-100s seen during the COVID Crash last year. Click here to view Bespoke’s premium membership options for our best research available.

Bespoke’s Morning Lineup – 3/30/21 – Gloomy Gold
See what’s driving market performance around the world in today’s Morning Lineup. Bespoke’s Morning Lineup is the best way to start your trading day. Read it now by starting a two-week free trial to Bespoke Premium. CLICK HERE to learn more and start your free trial.
“The window to the world can be covered by a newspaper.” – Stanislaw Jerzy Lec
It’s more of the same this morning as futures are modestly negative, but higher interest rates are acting as a weight on the Nasdaq and growth stocks in general. The economic calendar is relatively light, with a report on home prices coming out at 9 AM eastern and Consumer Confidence at 10 AM. Crude oil and gold are both down sharply, but bitcoin is higher. In political news, President Biden will speak on Infrastructure this afternoon. In terms of the latest COVID trends, national declines have been inching higher, but the key as we discuss in the Morning Lineup is that among populations that have been widely vaccinated, case counts have remained contained.
Read today’s Morning Lineup for a recap of all the major market news and events including a discussion of the move higher in rates, a recap of international markets, some strong survey related economic data out of Europe, the latest US and international COVID trends including our series of charts tracking vaccinations, and much more.
Gold just hasn’t been able to get out of its way this quarter. Despite concerns over inflation, the yellow metal has been weak as interest rates rise. This morning alone, gold is trading down over 1.5% after trading down over 1% yesterday and on the verge of testing its recent lows.

With the quarter coming to a close tomorrow, gold is on pace for a double-digit percentage decline this quarter, making it the worst quarter in nearly five years and just the tenth quarterly decline of more than 10% in the last 45 years.

Daily Sector Snapshot — 3/29/21
Dallas Manufacturing Bounces Back After the Storm
The reporting period for the Dallas Fed’s Manufacturing Outlook Survey for the month of February had some overlap with the region’s winter storms, but the extent of the damages were likely not fully captured. Fast forward a month to the March report and the region appears to have seen a strong bounce back. This morning’s release saw a huge beat relative to expectations just like other regions’ manufacturing surveys for the month of March. The Dallas Fed’s reading on the region’s manufacturing sector was actually expected to decline to 16.5 from last month’s reading of 17.2; the second-highest level of the index since the start of the pandemic. Instead of falling, the index surged to a new high post-pandemic high of 28.9. That is the best level since August 2018. Prior to 2018, the only other times that there has been as strong of readings was in the first few years of the index’s history.

The General Business Activity index was far from the only one to come in with an impressive reading. Across the 16 indices, 13 are in the top decile of readings with three of those at record highs. Expectations came in more mixed with most indices still positive but at less impressive levels historically while just over half fell month over month in March. Overall, the report showed that general conditions continue to improve with higher growth in orders, ramping up of production and employment, and higher prices. Granted, given the survey asks respondents to report on the change in activity from the prior month (i.e. when the winter storms had dampened activity), some of these strong readings could be a result of base effects.
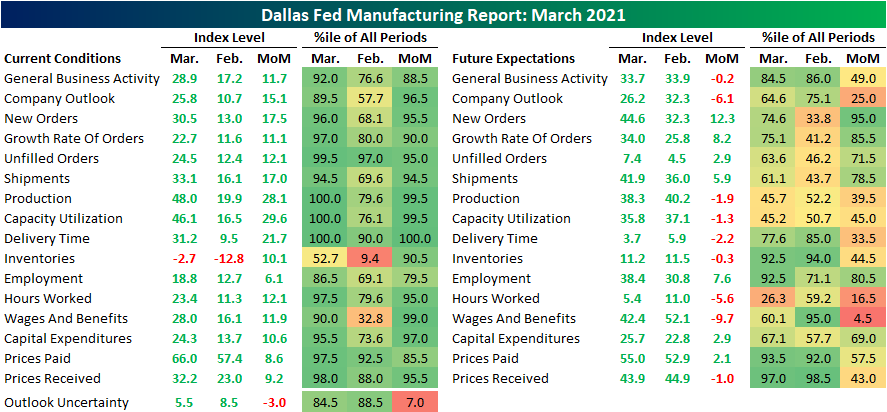
New orders have consistently grown over the past several months, but since the fall, that pace of improvement had generally plateaued. But with activity bouncing back after the storms, the indices for New Orders and Order Growth Rate both ripped higher in March. New Orders topped a reading of 30 for the first time since June 2018 this month while Order Growth Rate reached the highest level since May of that same year. Thanks to that growth in new orders plus an inability to fulfill existing orders last month, the index for Unfilled Orders has experienced a more unprecedented spike higher. The 12.1 point rise month over month was in the top 5% of all monthly moves leaving the index at the second-highest level on record behind September 2005 when it was 10 points higher. Given that massive backlog, Shipments also have ramped up as the index rose 17 points to 33.1.

An even more impressive increase to gauge the effort being put in to meet that demand came from the indices for Production and Capacity Utilization. Both indices surged to new all-time highs.

Even though the region’s manufacturers have increased production significantly, supply chains are showing signs of stress. The index for Delivery Times soared by the highest amount in a single month on record to a new all-time high of 31.2, surpassing the previous record from September 2005 by almost 10 points.

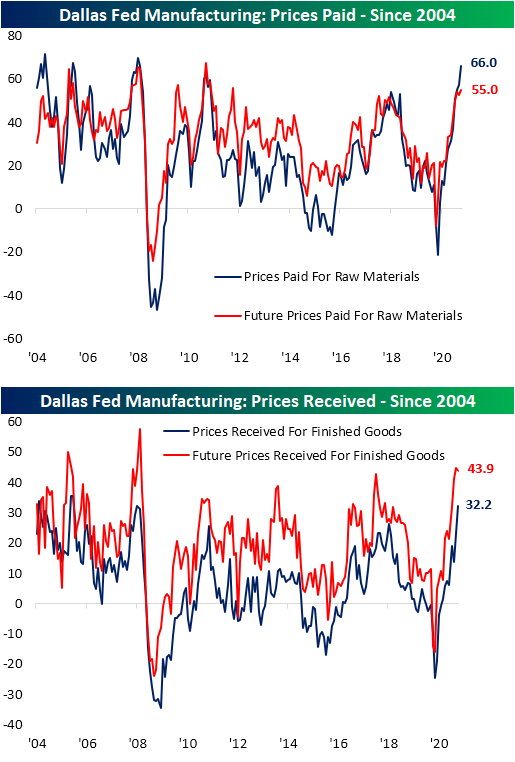
In addition to longer lead times, price growth is accelerating for both Prices Paid and Received. Prices Paid rose to 66 this month which is the sixth-highest level on record and a level that has not been seen since July 2008. The index for Prices Received is actually at a slightly higher end of its range (98th percentile versus 97.5th percentile for Prices Paid), but it too is at the highest level since 2008.
Finishing with a look at employment, although there was not a big pickup in the reading on firms increasing hiring, they appear to be making do with existing workers and are increasing incentives. The indices for Hours Worked and Wages & Benefits both saw increases in the top 5% of all months. In addition, Capital Expenditures also saw a big uptick in March. Click here to view Bespoke’s premium membership options for our best research available.
