B.I.G. Tips – Lay of the Land
Heading into the fifth month of 2021, one thing for sure this year is that it has been a lot calmer than last year. The S&P 500 closed out April in the midst of one of its narrowest short-term trading ranges in months, and it occurred right in the thick of earnings season! Anyone who’s been disappointed with the price action so far this year either has too much cash or is just plain greedy. The 4,200 level has been a short-term area of resistance for the S&P 500, though, and while it’s broken above that level in early trading today, we would wait until the close of trading for confirmation of the breakout.
Every sector is up so far YTD, and they’re all above their 50-DMAs. Ironically, sectors that have lagged like Consumer Staples and Utilities are still both overbought, while Energy, the best performing sector YTD, is barely above its 50-DMA. Along with Technology, which was one of just two sectors down last week, the Energy sector’s timing score ranks as ‘Good’.
Market rallies are always fun if you’re long equities, but with many groups trading at or near 52-week highs, risk/reward isn’t necessarily as attractive. Even in overbought markets, though, there are always opportunities.

In our just-released B.I.G. Tips report, we’ve provided an update to our “Lay of the Land” report which summarizes the performance and chart patterns of every S&P 500 Industry over the last year. For anyone looking for a snapshot of where things stand from a technical perspective heading into the crucial month of May, this report is a must-read. To see the report, sign up for a monthly Bespoke Premium membership now!
Bespoke’s Morning Lineup – 5/3/21 – Same Day, Different Month
See what’s driving market performance around the world in today’s Morning Lineup. Bespoke’s Morning Lineup is the best way to start your trading day. Read it now by starting a two-week free trial to Bespoke Premium. CLICK HERE to learn more and start your free trial.
“Time is the scarcest resource and unless it is managed, nothing else can be managed.” – Peter Drucker
As hard as it may be to believe, your calendar is right; it is May, and 2021 is already a third of the way behind us. If you feel like time has gotten away from you, don’t worry, there are still eight months left. From the market’s perspective, the first trading day of May is looking a lot like the first day of April which looked a lot like March which looked a lot like February. All three starts to those months came with heavy buying as the S&P 500 was up over 1% all three times! Futures aren’t quite that strong this morning, but the S&P 500 is indicated to open higher by half of one percent.
On the economic calendar, the major report of the day is the ISM Manufacturing at 10 AM. Economists are collectively expecting a level of 65.0 versus March’s reading of 64.7 which was the highest level since the early 1980s.
Read today’s Morning Lineup for a recap of all the major market news and events including the biggest overnight events, some key earnings reports, economic data from around the world, as well as the latest US and international COVID trends including our vaccination trackers, and much more.

We highlighted it in this week’s Bespoke Report, but we wanted to show again this morning how strong economic data was in the month of March. In our Matrix of Economic Indicators each month we summarize the y/y change in more than 30 different economic indicators and highlight whether they are showing positive or negative momentum versus their prior month’s y/y reading. We also track the net number of indicators showing positive momentum on a monthly basis over time.
For the month of March, only one of the economic indicators in our Matrix showed negative momentum while the remaining 35 all had positive momentum. While we’ve seen a lot of strength in the number of indicators showing positive momentum coming out of the pandemic, we have never seen anything nearly as strong as March’s net reading of +34. While March was exceptionally strong, the combination of a bounce back from economic weakness in February due to winter storms, tons of stimulus, and easy comps relative to March 2020 makes it unlikely that this degree of positive momentum will be matched again.

Berkshire Hathaway and The Annual Meeting
Over the weekend, Warren Buffett and Charlie Munger sat down for Berkshire Hathaway’s annual shareholder meeting. While the annual discussions are always chock full of insight regarding current issues in financial markets, below we wanted to show how Berkshire Hathaway’s (BRK.A) class A shares have performed leading up to and after these meetings. We use class A shares rather than the more affordable and liquid class B shares due to their more extensive history, but the two typically trade similarly with a correlation coefficient of their daily moves at 0.95.
This year, the stock heads into the annual meeting with a 19.62% year-to-date gain. That ranks as the third-best year since 1994 with the only larger YTD gains heading into the meeting being a 21.52% gain in 2013 and a 50.65% gain in 1998. On average, the first trading day after the meeting (or the day it took place in the case of the years before 2000 when the meeting was held on a Monday; highlighted in gray below) has typically seen the stock move higher with an average gain of 0.3%. Returns through the end of the week that the meeting is held also hold a positive bias with a 40 bps average gain and positive returns 59% of the time.
One month after the meeting, though, more often than not Berkshire has actually traded lower. In fact, outside of 2020, 2017, and 2013, every post-GFC year has seen BRK.A fall one month out with a median decline of 19 bps. Fortunately, those losses are usually recovered by 3 months later, and it has usually closed out the year in the green better than three-quarters of the time. Click here to view Bespoke’s premium membership options for our best research available.

Bespoke Brunch Reads: 5/2/21
Welcome to Bespoke Brunch Reads — a linkfest of the favorite things we read over the past week. The links are mostly market related, but there are some other interesting subjects covered as well. We hope you enjoy the food for thought as a supplement to the research we provide you during the week.
While you’re here, join Bespoke Premium with a 30-day free trial!
Policy Proceeds
A lot of people are spending their third stimulus checks on home improvements by Zlati Meyer (Fast Company)
Spending on broken down appliances and other home improvement projects is a popular way to put money from the most recent round of stimulus payments to work. [Link; paywall]
Automatic Aid for the People? How Jobless Benefits Can Fit the Economy. by Neil Irwin (NYT)
While jobless claims surged as a result of the pandemic and covered expenses for millions of Americans, there were massive gaps in coverage as the system to struggled to deal with the wave of cases; ad hoc approaches to boosting benefits didn’t help as states struggled to implement new benefits. [Link; soft paywall]
Taxes
Biden Targets $41 Billion Tax Break for Rich Real Estate Investors by Emily Cadman (Bloomberg)
The tax provision which allows investors to avoid capital gains when rolling real estate investment from one deal to the next is on the chopping block in Biden administration tax proposals. [Link; soft paywall]
ETFs Stand To Win Big If Biden Raises Capital Gains Taxes, Report Says by Tracey Longo (FA Mag)
ETFs tend not to pass capital gains taxes on to investors, unlike many mutual funds which do so, creating an advantage for the pass-through exchange-traded funds. [Link]
Supply Problems
How blackouts, fires, and a pandemic are driving shortages of pipette tips — and hobbling science by Kate Sheridan (Stat News)
The small, simple plastic devices that facilitate testing and various biological research are in extremely short supply thanks to both disrupted supply chains and exploding demand due to vaccine research. [Link]
Lumber is shockingly expensive. Thanks, Obama. by Ryan Cooper (The Week)
The chaos in lumber markets is a good example of how a huge drop in demand can lead to higher prices than if demand had been preserved in the first place. [Link]
CEOs
I Think I Found Jamie Dimon’s Secret Instagram Account by Ashley Feinberg (Trashberg)
An investigation into whether the CEO of JP Morgan is lurking on social media. The author manages to locate Twitter and Instagram accounts that are most likely where Dimon scrolls the timeline. [Link]
Startup CEO says he was fired for microdosing LSD at work by Sarah McBride (Fortune)
The head of a marketing startup was fired by the board of his business for taking a small amount of LSD prior to a meeting in 2019. [Link]
Covid Treatments
Brazil health regulator rejects Russia’s Sputnik vaccine by Ricardo Brito (CTV News/Reuters)
While reviewing the Sputnik COVID vaccine (based on an adenovirus vector similar to the Johnson & Johnson or AstraZeneca jabs), Brazil’s health regulatory discovered that the vaccine’s designers had neglected to delete some of the adenovirus genetic code, meaning the vaccine is effectively a live virus. [Link]
Pfizer is testing a pill that, if successful, could become first-ever home cure for COVID-19 by Paul Nuki (National Post/Telegraph)
A protease inhibitor that works similar to some HIV medication attacks the virus, reducing the severity of infections as soon as signs emerge that they are present. [Link]
Contrarian Signals
One in Four Shares in $12 Billion Bond ETF Are Now Sold Short by Katherine Greifeld (Bloomberg)
25% of the widely-held bond ETF TLT are sold short as investors bet on higher interest rates amidst large outflows. That’s the highest degree of short interest since 2017. [Link; soft paywall]
Pandemic Shifts
Google Is Saving Over $1 Billion a Year by Working From Home by Mark Bergen (Bloomberg)
Activities like travel and entertainment that are no longer a part of the corporate tool kit are saving Google (and other companies) huge sums. [Link; soft paywall]
Golf Resurgence During Covid Boosts Puma as Nike, Adidas Miss Out by Tim Loh (Bloomberg)
Sports that can be played outdoors and alone have seen a massive increase in popularity thanks to COVID, a boon to sportswear brand Puma and a missed opportunity for larger brands like Nike. [Link; soft paywall]
Silly Season
The counterparty puzzle: the curious case of the Miami jewellery designer, the government’s PPE scandal and the lawyer on its trail… by Jonathan Heaf (GQ)
Public contracts for PPE in the UK led to billions in spending on companies that had little to no experience as vendors, including a Miami-based designer. [Link]
The World Knows Her as ‘Disaster Girl.’ She Just Made $500,000 Off the Meme. by Marie Fazio (NYT)
A UNC student made half a million dollars selling an non-fungible token giving the owner rights to 90% of sales related to a meme that came from a photo of her as a four year old outside a house fire in Mebane, NC. [Link; soft paywall]
Read Bespoke’s most actionable market research by joining Bespoke Premium today! Get started here.
Have a great weekend!
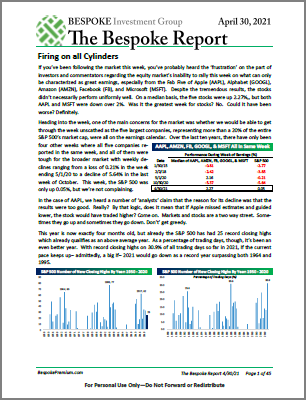
The Bespoke Report Weekly Newsletter – 4/30/21
This week’s Bespoke Report newsletter is now available for members.
If you’ve been following the market this week, you’ve probably heard the ‘frustration’ on the part of investors and commentators regarding the equity market’s inability to rally this week on what can only be characterized as great earnings, especially from the Fab Five of Apple (AAPL), Alphabet (GOOGL), Amazon (AMZN), Facebook (FB), and Microsoft (MSFT). Despite the tremendous results, the stocks didn’t necessarily perform uniformly well. On a median basis, the five stocks were up 2.27%,, but both AAPL and MSFT were down over 2%. Was it the greatest week for stocks? No. Could it have been worse? Definitely.
Heading into the week, one of the main concerns for the market was whether we would be able to get through the week unscathed as the five largest companies, representing more than a 20% of the entire S&P 500’s market cap, were all on the earnings calendar. Over the last ten years, there have only been four other weeks where all five companies reported in the same week, and all of them were tough for the broader market with weekly declines ranging from a loss of 0.21% in the week ending 5/1/20 to a decline of 5.64% in the last week of October. This week, the S&P 500 was only up 0.05%, but we’re not complaining.
In the case of AAPL, we heard a number of ‘analysts’ claim that the reason for its decline was that the results were too good. Really? By that logic, does it mean that if Apple missed estimates and guided lower, the stock would have traded higher? Come on. Markets and stocks are a two-way street. Sometimes they go up and sometimes they go down. Don’t’ get greedy.
As usual, this week’s Bespoke Report covers the major forces that are driving equity markets right now. To read the report and access everything else Bespoke’s research platform has to offer, start a two-week free trial to one of our three membership levels. You won’t be disappointed!

Daily Sector Snapshot — 4/30/21
Wild Data Close To Q1
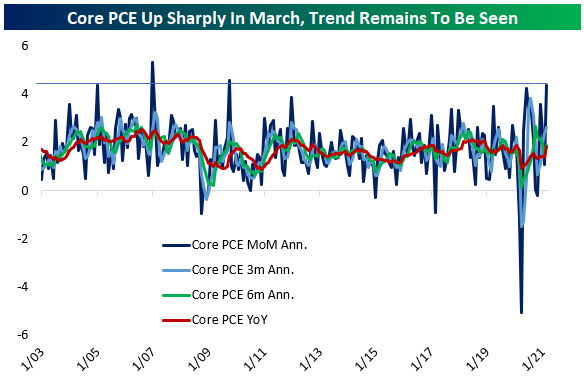
Today was quite the day for economic data, with two key releases from the Bureau of Economic Analysis (BEA) and Bureau of Labor Statistics (BLS). We’ll start with BEA data on personal income and spending in March.
First, as shown below, the savings rate surged in the month, with households saving 27.6% of personal income net of taxes. That’s a huge number, even by the standards of the elevated savings rates that we’ve seen over the course of the pandemic.

The reason there was so much saving going on is that transfer payments rose by more than $300bn on the month, driven by the delivery of economic impact payments also known as “stimulus checks” or even shorter: “stimmies.”

Incomes also rose thanks to rebounding labor market activity following winter storms in Texas during February and the longer-term trend of reopening across the economy. As shown, the 13.5% annualized growth of wage and salary income in the month was very strong. It was also helped along by wage growth, which we will discuss later on.

With spending surging thanks to stimulus checks and other factors, core personal consumption expenditure prices surged by the most MoM since 2009, over 4% annualized. The 4% move was in no small part due to the swing in activity from February to March, and isn’t likely to be sustained, but it is a helpful indicator that prices may be more robust in this recovery than they were during the low inflation post-GFC period.
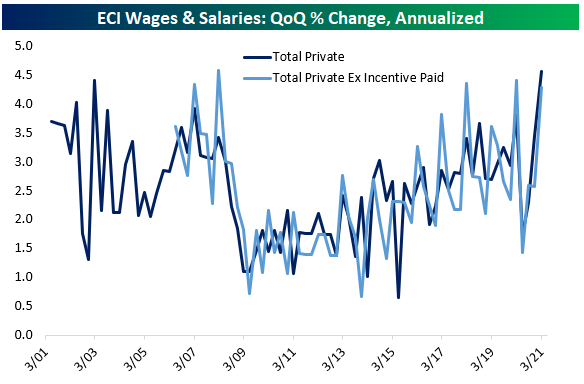
For broad inflation that will concern the Fed, one factor that will be needed along with steadily rising prices is strong wage growth. The second big report today was Q1 wages in the BLS Employment Cost Index (ECI). The ECI does a better job of measuring wage growth than other series because it accounts for changes in the composition of employment over time. As shown in the chart below, Q3 saw the strongest sequential wage growth on record, with a 4.6% annualized advance in wages versus Q4. Some of that came from incentive-paid occupations, which benefit from bonuses and related payments, skewing the results. As shown in the chart, though, there was very strong wage growth even excluding incentive-paid occupations. Anecdotal reports of very tight labor markets amidst booming reopening demand got support from this release. Click here to view Bespoke’s premium membership options for our best research available.
B.I.G. Tips – Charts We’re Watching
Bespoke’s Morning Lineup – 4/30/21 – The Smaller The Better
See what’s driving market performance around the world in today’s Morning Lineup. Bespoke’s Morning Lineup is the best way to start your trading day. Read it now by starting a two-week free trial to Bespoke Premium. CLICK HERE to learn more and start your free trial.
“No man’s knowledge here can go beyond his experience.” – John Locke
Well, we have almost made it through what has in many cases been the busiest week of the year. Between the busiest week of earnings season for the S&P 500, a lot of economic data, and an FOMC decision, there was no shortage of catalysts this week, but there was little downside associated with any of them as equities- at the index level- continue to defy gravity. Not only have we made it through a busy week, but 2021 is already a third over! Time flies when you’re having fun!
Read today’s Morning Lineup for a recap of all the major market news and events including the biggest overnight events, some key earnings reports, economic data from around the world, as well as the latest US and international COVID trends including our vaccination trackers, and much more.
Heading into the week, investors were on edge with the looming earnings reports from the S&P 500’s largest companies all coming in the same week. Expectations were already high, but were they too high? While not all of the major companies reporting impressed investors, the major equity indices have made it through the week unscathed. While equity futures are indicated lower this morning, every major index in our Trend Analyzer has seen positive returns over the last five trading days and in a number of cases big gains.
This week’s performance has been mostly contingent on market cap- the smaller the better. The top-performing index over the last five trading days is the Russell Micro-Cap index (+3.56%), while the Dow is the only index ETF that is up less than 1%. In between those two extremes, market cap has clearly played a role in performance with small caps performing best and large caps doing not as well. That’s basically been the story when it comes to YTD performance as well, although, towards the end of Q1, we saw the opposite trend play out. Ironically, even though the Micro-Cap ETF is the top-performing ETF over the last week and YTD, it is the only ETF that isn’t overbought, and it’s actually just barely above its 50-DMA.

The Bespoke 50 Top Growth Stocks — 4/29/21
Every Thursday, Bespoke publishes its “Bespoke 50” list of top growth stocks in the Russell 3,000. Our “Bespoke 50” list is made up of the 50 stocks that fit a proprietary growth screen that we created a number of years ago. Since inception in early 2012, the “Bespoke 50” is up 476.3% excluding dividends, commissions, or fees. Over the same period, the Russell 3,000’s total return has been +271.6%. Always remember, though, that past performance is no guarantee of future returns. (Please read below for more info.) To view our “Bespoke 50” list of top growth stocks, please start a two-week trial to either Bespoke Premium or Bespoke Institutional.

The Bespoke 50 performance chart shown does not represent actual investment results. The Bespoke 50 is updated weekly on Thursday. Performance is based on equally weighting each of the 50 stocks (2% each) and is calculated using each stock’s opening price as of Friday morning each week. Entry prices and exit prices used for stocks that are added or removed from the Bespoke 50 are based on Friday’s opening price. Any potential commissions, fees, or dividends are not included in the performance calculation. Performance tracking for the Bespoke 50 and the Russell 3,000 total return index begins on March 5th, 2012 when the Bespoke 50 was first published. Past performance is not a guarantee of future results. The Bespoke 50 is meant to be an idea generator for investors and not a recommendation to buy or sell any specific securities. It is not personalized advice because it in no way takes into account an investor’s individual needs. As always, investors should conduct their own research when buying or selling individual securities.