B.I.G. Tips – Green Pulse
ARK Sinking?
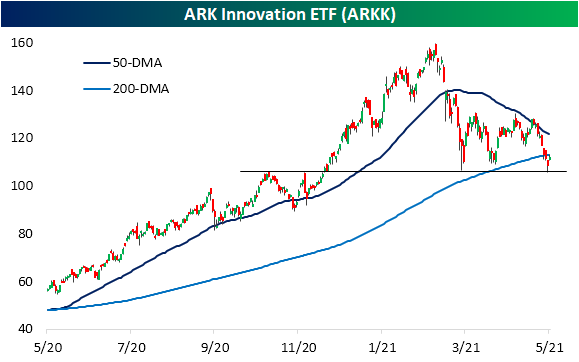
The recent struggles of the ARK Innovation ETF (ARKK) have been well-documented, so while there’s no reason to state the obvious, the last couple of days have been notable for a couple of reasons. ARKK broke and closed below its 200-day moving average (DMA) for the first time in over a year last week. It then attempted to bounce on Friday, but as shown in the zoomed-in inlay on the chart, the bounce ran out of steam just at the 200-DMA (two cents above) before reversing lower. Today, that reversal has continued to pick up steam, and ARKK is now in danger of closing below its breakout point from late 2020.

In looking at the rise and fall of ARKK over the last year, it’s interesting to note that Google Search trends for the ticker ‘ARKK’ peaked within a couple of days of the ETF’s peak.

Through Monday Morning, ARKK is already down 13% in May, which would rank as the 5th worst month since the ETF’s launch in late 2014. Remember that it’s only May 10th! The table below lists ARKK’s 25 largest holdings and their performance so far this month, this year, and over the last 12 months. Tesla (TSLA) is ARKK’s largest holding, and while it’s down sharply this month, it’s actually doing better than ARKK with a MTD decline of 9%. What really stands out on this table is the fact that all 25 of the ETF’s largest holdings are down MTD. It’s pretty bonkers that performance has been this overwhelmingly negative especially in a month where the S&P 500 is up over 1%. The fact that performance has been so weak relative to the rest of the market hints at the possibility that some investors are actively betting against the fund’s holdings as growth stocks fall out of favor.
With such large declines already in May, the YTD performance of ARKK’s holdings has only gotten worse. Even with the S&P 500 up over 10% YTD, all but three of the 25 largest holdings are in the red on the year with four stocks losing more than a third of their value. In spite of all the short-term weakness, though, the performance of ARKK’s largest holdings over the last 12 months remains strong and is one reason why investors have been willing to stick with the company’s funds up to this point. Click here to view Bespoke’s premium membership options for our best research available.

Bespoke’s Morning Lineup – 5/10/21 – Inflation Week
See what’s driving market performance around the world in today’s Morning Lineup. Bespoke’s Morning Lineup is the best way to start your trading day. Read it now by starting a two-week free trial to Bespoke Premium. CLICK HERE to learn more and start your free trial.
“Remember that stocks are never too high for you to begin buying or too low to begin selling.” – Jesse Livermore
It’s looking like a mixed start to the week and a bit of a reversal of Friday’s trade as the Nasdaq lags while the S&P 500 and Dow futures are both higher. Commodities are flying again this morning as copper is on pace for its third straight 2%+ daily gain and Energy commodities trade higher on the news of the Colonial Pipeline outage over the weekend.
The economic calendar is empty today, but with the moves we’ve already seen in commodities plus updates on CPI and PPI later in the week, inflation will be a major theme of the week.
Read today’s Morning Lineup for a recap of all the major market news and events including a recap of overnight earnings reports and economic data, updates on the major moves in commodities, as well as the latest US and international COVID trends including our vaccination trackers (which continue to show a significant deceleration in vaccine uptake), and much more.

Based on the first week’s performance, May started off with another run for cyclical stocks. In a week where seven of eleven sectors finished in the green, the biggest winners were Energy, Materials, Financials, and Industrials, which were all up over 3%. All four sectors are also leading on a YTD basis and the most extended relative to their 50-DMAs. With the rallies, though, also comes overbought levels, and in the case of Financials, Materials, and Energy, they all closed out last week at ‘extreme’ overbought levels.
So, who’s lagging? Utilities, Real Estate, Consumer Discretionary, and Technology were the only four sectors down last week, and besides Real Estate, they are also the only sectors that aren’t currently overbought.

Bespoke Brunch Reads: 5/9/21
Welcome to Bespoke Brunch Reads — a linkfest of the favorite things we read over the past week. The links are mostly market related, but there are some other interesting subjects covered as well. We hope you enjoy the food for thought as a supplement to the research we provide you during the week.
While you’re here, join Bespoke Premium with a 30-day free trial!
Stock Drama
BlackRock Starts to Use Voting Power More Aggressively by Dawn Lim (WSJ)
The giant fund company is starting to put its proxy votes where its mouth, with a sharp increase in the number of environmental, social, and governance proposals in the first half of this proxy year versus the prior year when only a tiny fraction of those categories got support from the ubiquitous index fund provider. [Link; paywall]
Berkshire Hathaway’s Stock Price Is Too Much for Computers by Alexander Osipovich (WSJ)
The un-split A-shares of Berkshire have neared a maximum value that NASDAQ’s trading systems can handle, with shares knocking on a magic and unfortunate limit of $429,496.7295 per share. [Link; paywall]
Pandemic Culture
The Hot-Person Vaccine by Kaitlyn Tiffany (The Atlantic)
Tastemakers have landed on the Pfizer jab as the must-have injection of the vaccination season, for reasons that completely escape just about everyone. [Link; soft paywall]
New York City Is Roaring Back to Life, One Year After Its Nadir by Misyrlena Egkolfopoulou (Bloomberg)
With more than half of NYC vaccinated, the subway is going back to 24 hour service, and bars are opening up as the giant metropolis shakes off the past 13 months of cobwebs that made it a shadow of its former self. [Link; soft paywall]
Too Much Zoom
Even the CEO of Zoom Says He Has Zoom Fatigue by Chip Cutter (WSJ)
A never-ending slog of video calls is creating burnout and driving executives to push for a return to the office sooner rather than later, with even the CEO of remote work posterchild Zoom reporting fatigue over video calls. [Link; paywall]
‘I Used to Like School’: An 11-Year-Old’s Struggle With Pandemic Learning by Rukmini Callimachi (NYT)
For students that don’t have access to reliable internet, remote schooling has been an enormous burden, and one that has fallen overwhelmingly on non-white children. [Link; soft paywall]
Big Shifts
A Farmer Moved a 200-Year-Old Stone, and the French-Belgian Border by Anna Schaverian (NYT)
In Belgium, a treaty dating back to a post-Napoleonic years was violated by a farmer moving an inconvenient stone border marker to the edge of his field. [Link; soft paywall]
Microsoft is rolling out a new default font to 1.2 billion Office users after 14 years — and the designer of the old one is surprised by Jordan Novet (CNBC)
Vaunted workhorse of office documents Calibri is taking a back seat, with one of five potential replacements announced this week set to take the crown from the default font of Word, Excel, and other MS Office documents. [Link]
Demography
Births in U.S. Drop to Levels Not Seen Since 1979 by Janet Adamy (WSJ)
The number of American newborns dropped 4% in 2021 as birth rates fell to the lowest levels on record dating to at least the 1930s, with the lowest number of babies since 1979. [Link; paywall]
Renewables
Trends in electricity prices during the transition away from coal by William B. McClain (BLS)
Producer price indices for electricity in regions that use more renewable power have grown less over the long term than those in regions with less renewables generation. [Link]
Hollywood
‘A Quiet Place’ Stars Think Paramount Owes Them Money by Lucas Shaw (Bloomberg)
With studios shifting theatrical releases to streaming networks, actors are scrambling to protect their share of proceeds; contracts typically give huge names a share of box office receipts that are being skimmed off thanks to shorter theater runs. [Link; soft paywall]
Read Bespoke’s most actionable market research by joining Bespoke Premium today! Get started here.
Have a great weekend!
Daily Sector Snapshot — 5/7/21
The Bespoke Report – 5/7/21 – How Does This Keep Happening? Earnings Still Strong vs Estimates In Q1
This week, we’re sharing a quick update on the global macro backdrop, with a review of cross asset performance, global equity markets, COVID vaccinations, payrolls data, earnings results from the current season, the outlook for earnings going forward, extremely strong PMI readings, a booming housing market and its interest rate exposure, uncompelling credit market valuations, tight commodity markets and surging price pressure, the role of crypto in driving equity market risk appetite, the outlook for Fed policy, some trade ideas, and more.
This week’s Bespoke Report newsletter is now available for members.

To read the report and access everything else Bespoke’s research platform has to offer, start a two-week free trial to one of our three membership levels. You won’t be disappointed!

ARKK Stocks Breakdowns and Bounces
After struggling for most of the past couple months, momentum and Tech stocks are broadly outperforming today as the Nasdaq is up 1.25% compared to a 0.78% gain in the S&P 500. The ARK Innovation ETF (ARKK) has been a poster child of the momentum theme over the past year. After a 383.9% gain from the March 2020 low to its high in mid-February, ARKK has fallen around 30% in the months since then. For most of that time, the ETF consolidated between its 50 and 200-DMA. After a failed attempt to break above its 50-DMA at the end of April, it has taken a leg lower, falling below its 200-DMA for the first time in a year in the process. While ARKK has yet to move back above its 200-DMA, it has found support around $105 which traces back to the lows earlier this spring and the highs from the fall. In other words, from a technical perspective ARKK, as well as some of its holdings, still have plenty of technical hurdles including moving back above its moving averages and breaking the past few months’ downtrends. At least for the time being, the group has found some respite in the move higher today.
As for the individual holdings of the ARKK ETF, below we show the 25 largest which accounts for approximately three-quarters of net asset value. For the most part, these stocks continue to sit on huge gains from the past year (or since their market debut for those that have IPO’ed in the past year; bolded and bordered rows in the table below) with only a small handful in the red: Teladoc (TDOC), Coinbase (COIN), and Iovance Biotherapeutics (IOVA). Even though the 25 largest ARKK holdings are on average up 117% over the past year, they have certainly been a pain trade recently. Most of these names are deeply oversold at the moment, and relative to their 52-week highs, they are down 35% on average. In fact, of all 58 holdings, there are only four—Intercontinental Exchange (ICE), TuSimple (TSP), Trimble (TRMB), and PACCAR (PCAR)—that are less than 10% below their 52-week highs, and none of these break into the top 25 largest holdings (as such they are not pictured below).

While ARKK holdings have generally been weak over the past few months, in recent days there have been some notable developments in the charts of these names. Some of these like CRISPR Therapeutics (CRSP) and EXACT Sciences (EXAS) have fallen below the long-term 200-DMA. Other names in the ETF broke below their 200-DMA a while ago now, and their charts do not look much better. Stocks like Invitae (NVTA), Materialise (MTLS), and Teladoc (TDOC) collapsed below their long-term moving averages earlier this spring and this week’s moves lower have resulted in breaks of critical support levels. For TDOC and MTLS, those levels have previously marked support at multiple points in the past year. One other interesting name in terms of performance today is Regeneron (REGN). Unlike many other ARKK stocks, REGN has actually been trending higher since March, albeit that is in the context of a much longer-term downtrend than many other ARKK holdings. Regardless, that recent rally has resulted in the stock to run right up to its long-term downtrend. In another move that is out of sync with its peers, today it has reversed lower, failing to break out from that downtrend.

While most names have pulled back sharply and continue to trend lower to sideways at best, that is not to say all ARKK stocks have entirely negative charts. Similar to the ETF’s chart, there are several names that have found support in the past couple of days. For example, DocuSign (DOCU), Iovance Biotherapeutics (IOVA), Palantir (PLTR), and Spotify (SPOT) are all bouncing off critical support levels of the past year. For others like Fate Therapeutics (FATE), Iridium (IRDM), PagerDuty (PD), PACCAR (PCAR), and Synopsis (SNPS), those support levels have also coincided with their moving averages. PACCAR is also notable in that it is even breaking back above its 50-DMA today. Similarly, Novartis (NVS) is attempting to move back above its 200-DMA. Perhaps one of the most technically strong stocks of these has been Sea Ltd (SEE). Over the past year, the 50-DMA has consistently provided reliable support. After a brief dip back below in March, in April it moved back above its 50-DMA and has once again successfully retested in the past week.
In order to keep track of the ARK Innovation ETF’s (ARKK) holdings, we created a custom portfolio that members can add here. Please note that this does not update real time and is only based on ARKK’s holdings as of 5/6/21.
As always, investors should do their own research before buying or selling any securities, and this chart analysis is in no way meant to be a buy or sell recommendation. Click here to view Bespoke’s premium membership options for our best research available.

Bespoke’s Morning Lineup – 5/7/21 – That Was Ugly
See what’s driving market performance around the world in today’s Morning Lineup. Bespoke’s Morning Lineup is the best way to start your trading day. Read it now by starting a two-week free trial to Bespoke Premium. CLICK HERE to learn more and start your free trial.
“Fear incites human action far more urgently than does the impressive weight of historical evidence.” – Jeremy Siegel
So much for the ‘million job print’. While economists were expecting to see a print of one million jobs, the actual print was barely even a quarter-million at 266K. Not only that but last month’s print was revised lower by nearly 150K. In reaction, the 10-year yield has plummeted below 1.5% and Nasdaq futures are surging up nearly 200. These reactions may be a little bit too much of a knee-jerk, so we’ll see how things play out as the day goes on.
Read today’s Morning Lineup for a recap of all the major market news and events including a recap of overnight earnings reports and economic data as well as the latest US and international COVID trends including our vaccination trackers (which continue to show a significant deceleration in vaccine uptake), and much more.
Just when it looked like things were going to start getting ugly for the Nasdaq yesterday morning, it not only stabilized but reversed higher to finish the day in positive territory. It was the first time since late March that the Nasdaq was down over 1% intraday but finished the day higher. It’s always tempting to try and read into these types of moves and see them as a significant event. The reality, though, is that they are too common to be considered all that significant. In the last year alone, there have been 16 other times where the Nasdaq was down over 1% intraday but finished the day higher, and in the last ten years, it’s happened more than 60 times.
Looking back at prior occurrences over the last year and ten years, the frequency of positive returns over the next week (~62%) for the Nasdaq is just as common following these occurrences as it is for all one-week periods over the same time period. That being said, while the frequency of positive returns is similar, the magnitude of the Nasdaq’s median move following these reversals is moderately higher (1.1% vs 0.55%).

Bespoke’s Weekly Sector Snapshot — 5/6/21
The Bespoke 50 Top Growth Stocks — 5/6/21
Every Thursday, Bespoke publishes its “Bespoke 50” list of top growth stocks in the Russell 3,000. Our “Bespoke 50” list is made up of the 50 stocks that fit a proprietary growth screen that we created a number of years ago. Since inception in early 2012, the “Bespoke 50” is up 468.7% excluding dividends, commissions, or fees. Over the same period, the Russell 3,000’s total return has been +266.6%. Always remember, though, that past performance is no guarantee of future returns. (Please read below for more info.) To view our “Bespoke 50” list of top growth stocks, please start a two-week trial to either Bespoke Premium or Bespoke Institutional.

The Bespoke 50 performance chart shown does not represent actual investment results. The Bespoke 50 is updated weekly on Thursday. Performance is based on equally weighting each of the 50 stocks (2% each) and is calculated using each stock’s opening price as of Friday morning each week. Entry prices and exit prices used for stocks that are added or removed from the Bespoke 50 are based on Friday’s opening price. Any potential commissions, fees, or dividends are not included in the performance calculation. Performance tracking for the Bespoke 50 and the Russell 3,000 total return index begins on March 5th, 2012 when the Bespoke 50 was first published. Past performance is not a guarantee of future results. The Bespoke 50 is meant to be an idea generator for investors and not a recommendation to buy or sell any specific securities. It is not personalized advice because it in no way takes into account an investor’s individual needs. As always, investors should conduct their own research when buying or selling individual securities.