Bespoke Stock Scores — 6/29/21
Chart of the Day: Facebook (FB) Joins The Trillion Dollar Club
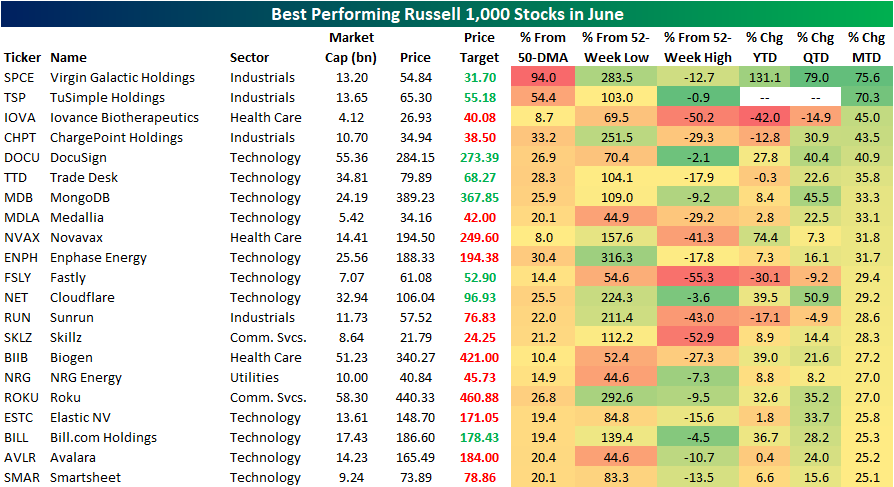
June’s Best and Worst Performing Russell 1,000 Stocks
The month of June, the second quarter, and the first half of 2021 are almost in the bag. In the table below, we take a look at the best and worst performers in the Russell 1,000 month to date. For the best performers, we look at the 21 names that are up at least 25% MTD. As for the other side of the performance spectrum, we show the 20 worst performers.
Topping the list with a 75.6% MTD rally through yesterday’s close has been Virgin Galactic (SPCE). A large portion of that has come in the past few sessions alone with a 38.87% gain last Friday which has been partially erased early this week. Given that huge one-day jump, SPCE is over 90% above its 50-DMA and as such, it is the stock that is currently the most extended above its 50-DMA in percentage terms of the whole Russell 1,000. The next best performer in the index has been a recent IPO (debuted on April 15th), TuSimple Holdings (TSP). The stock was also up over 70% in June through yesterday’s close leaving it just off its high from June 14th. After TSP and SPCE, there is a big drop in the percent change this month as Iovance Biotherapeutics (IOVA) is next up with a gain of 45%. That move has reversed some of the declines earlier in the year, although the price is still half of its 52-week high. It is a similar story for Fastly (FSLY) and Skillz (SKLZ) which are also more than 50% below their respective 52-week highs. Additionally, IOVA, FSLY and Sunrun (RUN) are the few names that are still down on the quarter even after being some of the top performers in June.
Pivoting over to the worst performers, there are 38 stocks in the Russell 1000 that are down double digits month to date. By far the worst of these has been CureVac (CVAC). Similar to how a significant portion of SPCE’s gains came from a single day, most of CVAC’s losses are a result of a 38.99% decline on June 17th. The catalyst for that decline was the announcement that the company’s COVID-19 vaccine was only 47% effective. The next worst performers are two more Health Care stocks that plummeted on disappointing trials data: Exelixis (EXEL) and Sage Therapeutics (SAGE). Of the 20 worst performing Russell 1,000 stocks, EXEL is the closest to a 52-week low. One of the next worst performers is the polar opposite. Upstart (UPST) is up massively off the past year’s lows, and even after the 16.41% decline MTD, the stock is still up over 200% on the year. While many Health Care names are at the bottom of the list of month-to-date performance, one other notable theme is reopening plays. Cruise liner Carnival (CCL) as well as multiple airlines like America (AAL) and Southwest (LUV) also found their way onto the list. Additionally, with metals like gold and copper broadly falling off their highs after significant runs over the past year, Reliance Steel & Aluminum (RS), Newmont (NEM), and Freeport-McMoRan (FCS) are also a few of the worst performers this month. Click here to view Bespoke’s premium membership options for our best research available.

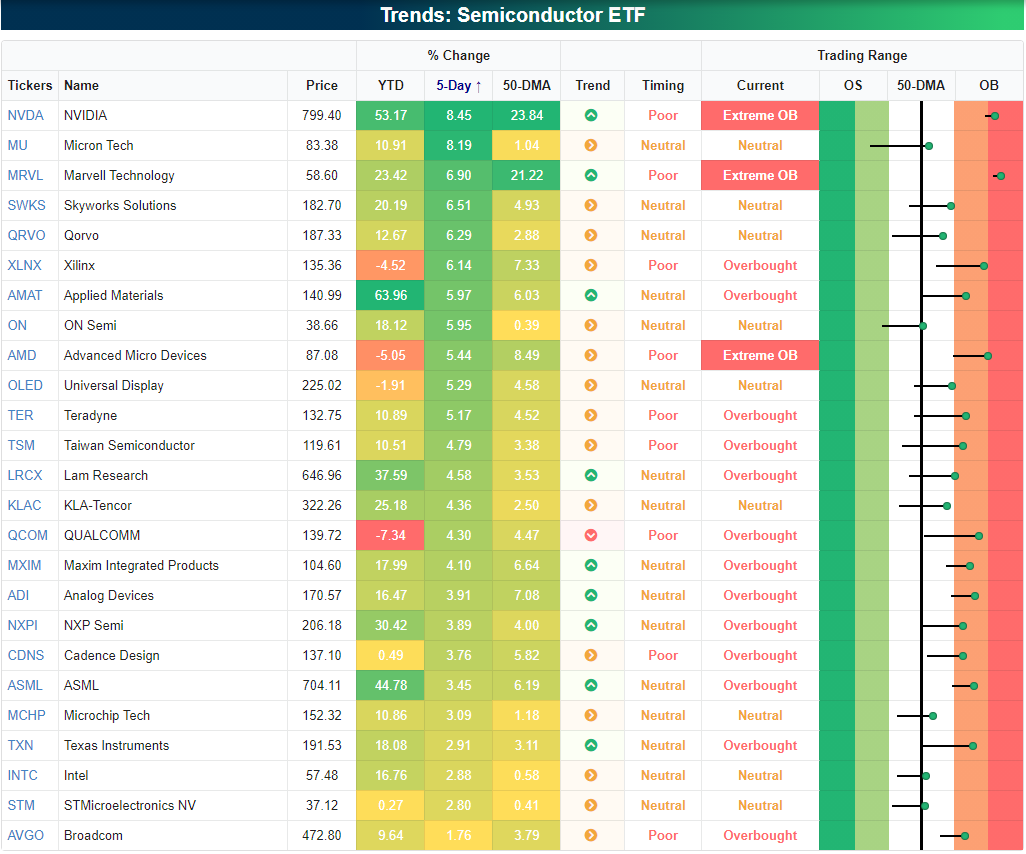
These SOX Aren’t Quitters
After a sideways period of consolidation that lasted more than four months, semiconductors enjoyed a nice rally to kick off the week as the VanEck Semiconductor ETF (SMH) rallied nearly 2.5% to a record high yesterday.

Below we highlight the performance of each individual component of SMH from our Trend Analyzer. While some stocks have clearly done the heavy lifting in the breakout to new highs, it’s pretty impressive to see that all 25 stocks in the ETF had positive returns over the trailing five days. Leading the way higher, both NVIDIA (NVDA) and Micron (MU) have rallied more than 8%, but another nine stocks in the ETF have gained more than 5% over the last week.
Despite the more than four month sideways range for the semiconductor sector, it’s been a very good year for most of the ETFs held in SMH. Just four of the holdings (QCOM, AMD, XLNX, and OLED) are in the red YTD, while the average gain of all 25 stocks is more than 17%. Leading the way higher, Applied Materials (AMAT) and NVIDIA are both up over 50% while four other stocks have tacked on 25% YTD. As a result of the big gains in the last week, the majority of stocks in the SMH ETF headed into today at overbought or extreme overbought levels, and all 25 stocks are above their 50-DMA. Click here to view all of Bespoke’s premium membership options and for a trial to any of our tiers of service.
B.I.G. Tips – Charts We’re Watching
Bespoke’s Morning Lineup – 6/29/21 – Modest Reversal of Monday Moves
See what’s driving market performance around the world in today’s Morning Lineup. Bespoke’s Morning Lineup is the best way to start your trading day. Read it now by starting a two-week free trial to Bespoke Premium. CLICK HERE to learn more and start your free trial.
“Some people get rich studying artificial intelligence. Me, I make money studying natural stupidity.” – Carl Icahn
Futures have been mixed for most of the morning, and while they were closer to the flatline earlier, we’ve seen some strengthening in the Dow futures and weakening in the Nasdaq as some of yesterday’s moves are reversing a bit. Today’s notable economic data point will be Consumer Confidence, and the only Fed speaker on the calendar is Richmond Fed President Thomas Barkin at 9 AM. Also just released, CPI in Germany declined to 2.1% y/y which was in line with forecasts. Lastly, in the financial sector, we’ve seen a number of dividend hikes and buyback announcements following stress test results yesterday. The results were largely expected, but two of the more notable dividend moves were Morgan Stanley (MS), which doubled its payment, and Citigroup (C) which left its payout unchanged.
Read today’s Morning Lineup for a recap of all the major market news and events from around the world, an update on the Delta variant, notable economic data from Asia and Europe, the latest US and international COVID trends including our vaccination trackers, and much more.

The S&P 500 and the Nasdaq have regularly been making new all-time highs in recent days, but that hasn’t been the case for many of the other major averages. Below we highlight the six-month price charts of a number of major US index ETFs. Outside of SPY (S&P 500) and QQQ (Nasdaq 100), none of the other four have hit new highs in at least a month. To be fair, the four indices that haven’t hit new highs are trading very close to new highs, so it’s not as though they are all breaking down, but as the third quarter kicks off, traders will look for some additional participation from the small and mid-cap areas of the equity market.

Daily Sector Snapshot — 6/28/21
Time to Watch the Paint Dry
July 4th is less than a week away and as Americans look to celebrate Independence Day, they will be taking significantly less time out of their day looking at the stock market. At least that’s the takeaway that comes with looking at average volumes during this time of year. The matrix below shows the median daily volume of the S&P 500 ETF (SPY) as a percentage of its 200-DMA for each day of the year going back to 1993.
The end of June typically has above average volumes which is not unheard of for not only month-end but also the end of the quarter. But once the calendar flips over into July, volumes typically dry up. July marks the second-worst first day of a month for volume in SPY; the worst is May with median volumes 2.78% below the 200-DMA. Leading up to the July 4th holiday, volumes plummet. In fact, the median volume on July 3rd has been less than half the 200-day average. The one caveat here is that when the stock market is open on July 3rd, it is usually a shortened session. The only other day of the year where median volume in SPY is further below its 200-DMA is December 24th, another half session. Turning back to July, volumes tend to remain below average throughout the rest of the month and through August as well with only a handful of above-average volume days. In fact, with just four days in the month where median volume is above its 200-DMA, July tends to have fewer above-average volume days than any other month. Click here to view all of Bespoke’s premium membership options and for a trial to any of our tiers of service.

Chart of the Day – The Best Time of the Year
Bespoke’s Morning Lineup – 6/28/21 – Starting the Sprint to the Finish
See what’s driving market performance around the world in today’s Morning Lineup. Bespoke’s Morning Lineup is the best way to start your trading day. Read it now by starting a two-week free trial to Bespoke Premium. CLICK HERE to learn more and start your free trial.
“In spite of the cost of living, it’s still popular.” – Kathleen Norris
Good Morning Subscriber,
It’s a quiet start to the new week with US futures mixed, treasury yields modestly lower, and crypto assets rallying. The economic calendar is also pretty quiet today with Dallas Fed Manufacturing the only release on the calendar. We will get some commentary throughout the day from Fed speakers, though, so those have the potential to cause some ripples in the market as they hit the wires. Overnight in Asia, the Chinese central bank said that the economy continues to improve and show signs of stability. In Europe, the trend has been modestly lower with Travel and Leisure stocks experiencing the largest declines while defensive catch a bid.
Read today’s Morning Lineup for a recap of all the major market news and events from around the world, an update on bitcoin and crypto technicals, the latest US and international COVID trends including our vaccination trackers, and much more.
Today brings the start of a new trading week but also marks the beginning of the sprint to the finish of Q2. With just three trading days left in the second quarter of 2021, the S&P 500 has already rallied 7.75% in what has been another impressive quarter. With stocks up strongly heading into quarter-end, there’s always a concern that the quarter will close off on a weaker note as portfolio managers look to rotate out of equities in order to get their weightings more in line with their target allocations. While rebalancing like this invariably does occur, long-term performance numbers do not suggest that it has a significant impact on market returns in the final days of the quarter- at least not when the gains are in the high single-digit percentage range and above.
The scatter chart below compares the S&P 500’s QTD returns up until the last three trading days of the quarter (x-axis) and compares that to the S&P 500’s performance in the last three trading days of the quarter. If there was an inverse relationship between QTD performance and returns in the last three trading days, you would expect to see dots higher up towards the left side of the chart and trending lower as you move right. As shown, that type of pattern is minimal at best.
On the right side of the chart, the shaded area represents all quarters where the S&P 500 was up over 5% heading into the last three trading days of the quarter, and we have enlarged that area in the lower chart. While the strongest quarter (Q1 1987) saw the S&P 500 decline 3% in the last three trading days of the quarter, other than that, the dots are scattered all over the place in no meaningful pattern. Of the 305 prior quarters since 1945, the S&P 500’s performance in the final three days of the quarter was a gain of 0.12% with positive returns 58% of the time. In the 113 quarters where the S&P 500 was up at least 5% heading into the final three trading days, though, the S&P 500’s average change to close out the quarter was a gain of 0.005% with positive returns 50.4% of the time. So there is some negative drag, but it’s minimal.
