Small Businesses Want More Employees and Inventories
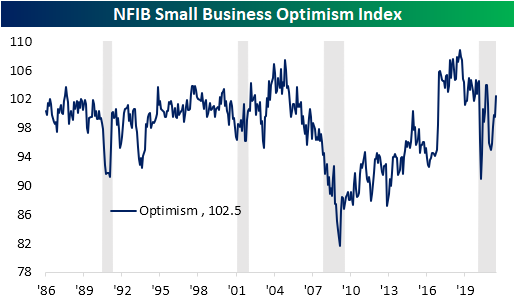
Early this morning, the NFIB released their June reading on small business sentiment. The headline reading has historically been correlated with changes in the political landscape and exactly that happened following last year’s Presidential election. However, the 2.9 point rise in June leaves the index fully recovered from its post-election losses as it came in at the highest level since September and October’s joint high of 104.
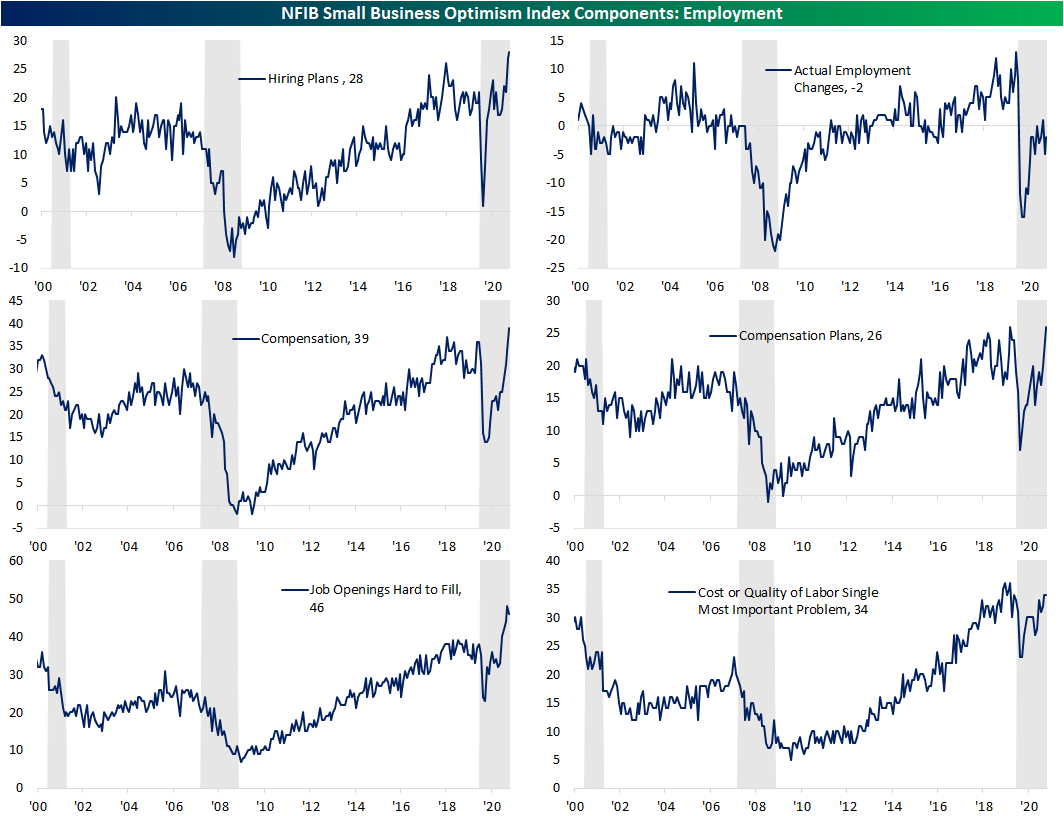
Breadth was generally strong across the categories of the report with seven of the ten inputs to the headline index rising month over month. As we noted earlier in the Morning Lineup, the indicators regarding employment are some of the most impressive. While actual employment changes remain negative, meaning more firms reported decreases than increases in hiring, hiring plans came in at a record high. In other words, businesses would like to be hiring more workers than they can. To make up for that, they are raising wages with both the indices for Compensation and Compensation Plans coming in at or near records. That appears to be enticing workers as there was a slight downtick in the number of firms reporting that openings are hard to fill in addition to the month-over-month uptick in the index for Actual Employment Changes.
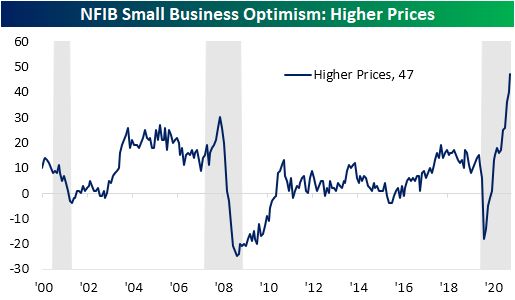
Wages are not the only area of inflationary pressure though. More broadly, a net 47% of businesses reported higher prices. That is far and away above the normal historical range and marked the third month in a row with a record high.
Wages and prices were not the only areas to see a record. The index of Inventory Satisfaction, which measures the net percentage of respondents saying current inventory levels are “too low” versus “too high,” is also at the highest level to date. While not at a record high, that sentiment has brought Inventory Accumulation (the net percentage of companies reporting actual increases versus decreases in inventory levels) to the highest level since October which is in the top 1% of all months in the history of the survey. While companies are investing in wages and inventories, capital expenditure readings are more muted. The indices for Capital Expenditure Plans and Actual Changes in Capital Expenditures came in the 19th and 15th percentiles. Click here to view Bespoke’s premium membership options.

Chart of the Day – New Highs Piling Up
B.I.G. Tips – Charts We’re Watching
Bespoke’s Morning Lineup – 7/13/21 – Moon Shots
See what’s driving market performance around the world in today’s Morning Lineup. Bespoke’s Morning Lineup is the best way to start your trading day. Read it now by starting a two-week free trial to Bespoke Premium. CLICK HERE to learn more and start your free trial.
Futures were mixed ahead of the June CPI report, but a much higher than expected print has been met initially with selling in equity futures and rising bond yields. So far, the declines haven’t been too large, but as traders digest the internals of the report, we’ll be watching to see how things play out. One driver of the gains this month was used car prices which rose 10.5% m/m and accounted for one-third of the total increase. New car prices also increased by 2.0% m/m which was the largest m/m increase since 1981!
Read today’s Morning Lineup for a recap of all the major market news and events from around the world, the latest US and international COVID trends including our vaccination trackers, and much more.

Like home runs coming off the bat of Pete Alonso in last night’s Home Run Derby, the S&P 500 is racking up record highs at an incredible pace lately. Over the last 12 trading days, there have been 10 record closing highs, bringing the YTD total up to 39. If the year ended today, 2021 would be tied for the 12th most record closing highs in a given year. At the current pace, though, the S&P 500 is on pace to have 74 record highs on a closing basis this year, and that would rank as the second most of all time, behind only 1995. The only other years even close to 1995’s total were 1964 (65) and 2017 (62). One caveat here is that, as the last two weeks have shown, new highs tend to come in bunches, but if the S&P 500 experiences a pullback, the rapid pace will dry up quickly. Wherever the 2021 total winds up, the pace so far this year has been impressive, to say the least.

Daily Sector Snapshot — 7/12/21
Chart of the Day: The Largest Stocks Reporting Earnings This Month
Inflation Expectations Surge
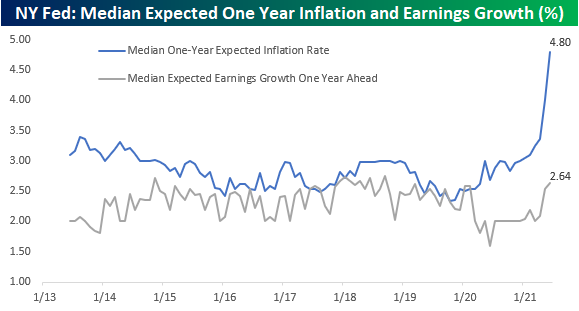
The New York Fed released its monthly Survey of Consumer Expectations (SCE) earlier today, and expectations for inflation over the next year surged to the highest level (4.8%) in the history of the survey (since June 2013). As shown in the chart below, inflation expectations have roughly followed actual levels of y/y CPI over the years, so with CPI surging to 5.0% in May, the spike higher in expectations shouldn’t come as too much of a surprise.

While the one year ahead forecast on the part of US consumers surged, expectations for the next three years have been more restrained, suggesting that consumers, like the Fed, expect these inflation pressures to be temporary.

In each month’s survey, respondents are also asked for their expected rate of earnings growth over the next twelve months. In this case, there’s a pretty big divergence between expected inflation (4.8%) and expected earnings growth (2.64%). In fact, the spread between the two has now widened out to a record 2.16 percentage points (second chart). There’s only so long that inflation can grow at nearly twice the rate of earnings growth.

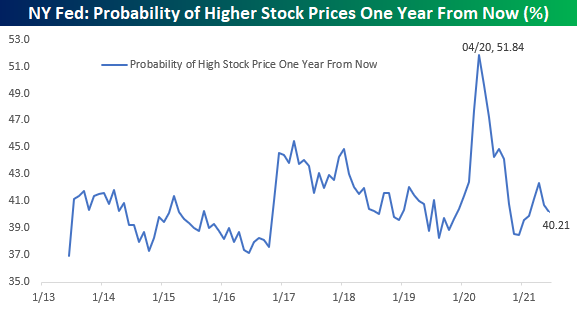
Among other questions, the SCE also asks consumers about their views towards the stock market. In this month’s survey, only 40.2% of consumers expect stock prices to be higher one year from now. In an environment where most sentiment surveys are overwhelmingly bullish, this survey of stock prices seems somewhat restrained. One interesting aspect of this part of the survey, though, is that in early 2020, when most sentiment surveys saw a spike higher in bearish sentiment, this one saw bullish sentiment surge to the highest level in the history of the survey. Click here to view Bespoke’s premium membership options and to sign up for a trial to any one of them.
Sleepy Small Caps
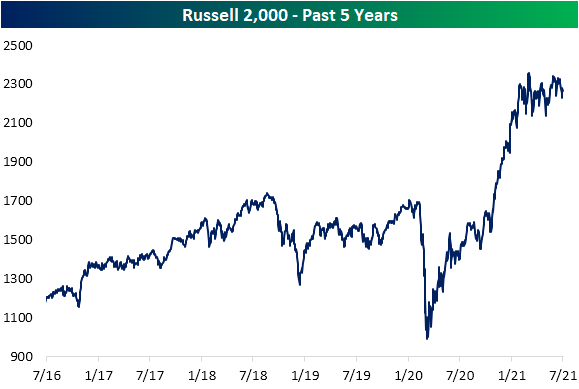
In the couple of years headed into the pandemic, the Russell 2,000 traded in a range having failed to take out its August 2018 high. After falling harder than large caps during the COVID crash, the Russell 2000 surged off of those lows and rallied 128.5%. Over the last six months, though, small caps have been stuck in another sideways range. As shown below, while the index had been on a strong run at the end of 2020 and into January of this year, the push higher has stalled out over the past several months.
While positive over the last six months (top left chart below), the Russell’s 8.29% gain has been middling relative to history ranking in just the 58th percentile. Further, with the index having trended sideways over the past few months, there has only been a 13.82% range between its 6-month closing high and low. That is actually at the low end (20th percentile) of the index’s historical six-month ranges. That lack of volatility comes after a historic move to the upside though.
As shown in the right-hand charts below, while current performance readings are coming back down to Earth given the past few months narrower range, the past year has seen record year-over-year changes. In fact, even after falling dramatically, the current reading is still in the top 3% of all year-over-year changes. The 52-week high/low range similarly hit record levels in the past year which have since cooled off but they too remain in the top decile of the index’s readings. In other words, the Russell 2,000 has been somewhat flat over the past several months, but it should make sense following the past year’s historic move higher. Click here to view Bespoke’s premium membership options.

June 2021 Headlines
Bespoke’s Morning Lineup – 7/12/21 – Grounded
See what’s driving market performance around the world in today’s Morning Lineup. Bespoke’s Morning Lineup is the best way to start your trading day. Read it now by starting a two-week free trial to Bespoke Premium. CLICK HERE to learn more and start your free trial.
“I believe that space travel will one day become as common as airline travel is today.” – Buzz Aldrin
While Richard Branson blasted himself into space over the weekend, futures are a lot more muted this morning as large-cap US equities are indicated modestly lower to start the week. One pocket of strength has been technology as the Nasdaq is trading moderately higher as a just-announced EU delay of implementing a digital tax has provided a boost.
Read today’s Morning Lineup for a recap of all the major market news and events from around the world, a discussion of economic data out of Japan, the latest US and international COVID trends including our vaccination trackers, and much more.
Friday was a good close to the week for small-cap stocks, but it wasn’t enough to erase the damage of the prior days as they were still the worst-performing market cap sector for the week. In the five days ending Friday, mega-cap dominated indices like the Nasdaq 100 and S&P 100 both rallied more than 1.5% and finished the week at either overbought or ‘extreme’ overbought levels. Other large-cap-oriented indices also rallied around 1% last week and also headed into the weekend at overbought levels. At the bottom of the list, all the small-cap focused index ETFs actually fell around 2% while the Micro-Cap ETF (IWC) dropped over 3%. So, while large caps are all overbought heading into the week, mid and small-cap index ETFs are either trading below or barely hanging on to their 50-DMAs.
