Dallas Manufacturing Slows With Some Silver Linings
Manufacturing activity in the Dallas Fed’s region continued to expand at a strong clip in July albeit with some slowing. The index for General Business Activity came in at 27.3 rather than the expected increase from 31.1 to 31.6. That decline marked the third month in a row that the index has fallen since the multi-year high of 37.3 in April. While current conditions deteriorated, expectations have held up better with a modest decline of 0.2 points this month.
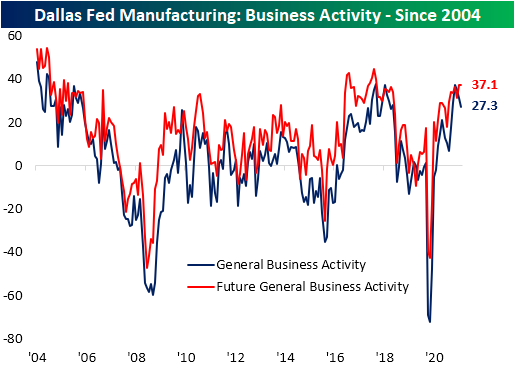
Most of the individual areas of the report saw a decline month over month in July with 12 of the 16 indices falling. Although most were lower, current levels remain broadly healthy with many in the top decile of their historic ranges. Expectations saw more broad declines with the only index to move higher month over month being Delivery Times. There were some particularly large double-digit declines in expectations for Shipments, Capacity Utilization, Inventories, and Prices Received.

One of the few areas of the report to see a move higher in July concerned new orders. The indices for New Orders and New Order Growth rate rose 0.1 and 2.4 points, respectively. Granted, those upticks still left both indices below their highs from earlier in the sping and expectations saw significant turns lower. While that could imply some slowing in demand, historic backlogs still exist. As shown in the bottom left chart below, outside of the spike in September 2005 and the past few months, the index for Unfilled Orders has never been higher even taking into account the declines over the past few months. Shipments also saw a small turn lower in July while the bigger move was in regards to expectations. Last month, expectations for shipments surged to the highest level since February 2006. This month, that reading reversed by 12.4 points; a month-over-month decline that ranks in the bottom 3% of all monthly moves.

Ironically, even though the reading on shipments worsened, supply chains appeared to have improved to some degree. Higher readings in the Delivery Time index indicate that products are facing longer lead times. Earlier this year the index surged to unprecedented levels, and while it still has a ways to go until it is back to normal, it did fall 7.2 points in July following a 3.2 point decline in June.

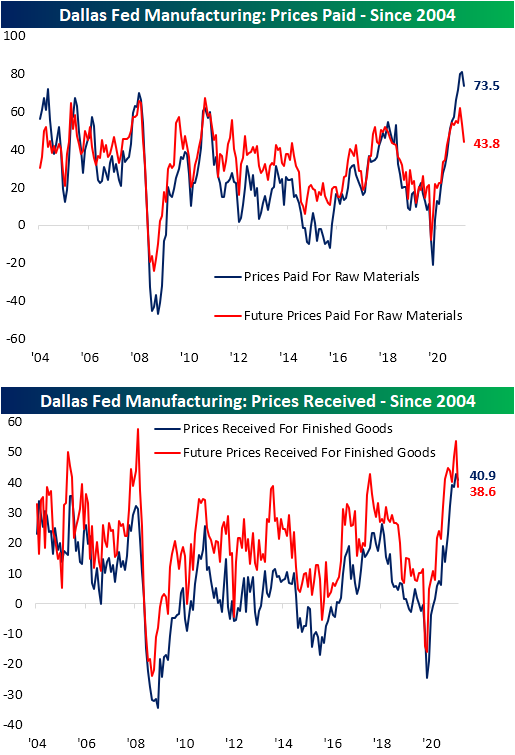
As with Delivery Times, prices have also found some respite after flying higher over the past several months. Prices Paid fell from a record high to 73.5 which is still the third-highest level of any month to date. Expectations also saw a sharp pivot lower falling 9.8 points to 43.8. That is at a similar level to three years ago. Prices Received are a similar picture pulling back from a record high to 40.9. Again even though this reading shows some slowing in price increases, there is no historical precedent for as high of a reading in the index. Additionally, expectations saw an even more dramatic decline as the index fell 15 points. Click here to view Bespoke’s premium membership options.
Bespoke’s Morning Lineup – 7/26/21 – Big Week for Earnings
See what’s driving market performance around the world in today’s Morning Lineup. Bespoke’s Morning Lineup is the best way to start your trading day. Read it now by starting a two-week free trial to Bespoke Premium. CLICK HERE to learn more and start your free trial.
“When the facts change, I change my mind.” – John Maynard Keynes
Futures are lower to kick off the week, but it’s nothing like last Monday and we’re also well off the lows from earlier. It’s a slow start, but we have a busy week of economic data ahead as well as a ton of earnings reports, and don’t forget about the FOMC meeting on Wednesday.
Read today’s Morning Lineup for a recap of all the major market news and events from around the world, the latest US and international COVID trends including our vaccination trackers, and much more.

There’s an old sketch from Saturday Night Live called “Mr. Short Term Memory” where Tom Hanks plays a character with a disorder where he has a limited short-term memory. As you might expect, the segment made for a few laughs when the character was in various situations like visiting a friend in the hospital or as a contestant on a game show. Looking at the market last week, it appears as though Mr. Short Term Memory is a guiding force in the market. Just a week ago, Dow futures were already down more than 500 points and the yield on the 10-year US Treasury was plummeting on concerns of rising COVID cases from the Delta variant. By Tuesday, though, those concerns were all water under the bridge as all of the major US averages not only finished in the green for the week, but they were all up over 1% as well.
Leading the way higher, the Nasdaq 100 (QQQ) rallied nearly 3% putting the index nearly 7% above its 50-day moving average. Even the Russell 2000 (IWM), which at one point on Monday was down over 10% from its record high, managed to finish the week up by more than 2%. Despite the rally, though, most small and mid-cap indices remain below their 50-day moving averages. However, despite all the commentary regarding the underperformance of small caps recently, they are still comfortably positive on the year, and besides IWM, there is a fairly strong degree of uniformity in YTD performance across the various market cap ranges.

Bespoke Brunch Reads: 7/25/21
Welcome to Bespoke Brunch Reads — a linkfest of the favorite things we read over the past week. The links are mostly market related, but there are some other interesting subjects covered as well. We hope you enjoy the food for thought as a supplement to the research we provide you during the week.
While you’re here, join Bespoke Premium with a 30-day free trial!
Recession
Business Cycle Dating Committee Announcement July 19, 2021 (NBER)
After the longest expansion in modern economic history, the National Bureau of Economic Research has officially declared the shortest recession on record, with the post-COVID trough coming after just two months of economic activity declines. [Link]
Renewables
A Process for Capturing CO2 from the Atmosphere by David W. Keith, Geoffrey Holmes, David St. Angelo, and Kenton Heidel (Joule)
This 2018 paper from the team at direct air capture start-up Carbon Engineering details a process for removing CO2 from the atmosphere at a cost of $94 to $232 per ton. For reference, a barrel of oil contains 0.43 tons of CO2. [Link]
When a Coal Plant Gets Built on Top of a Highway, What Happens When It Closes? by Nachy Kanfer (RMI)
A FirstEnergy (FE) coal-fired power plant in rural Ohio is an excellent case study for how shifts in power production are making coal uncompetitive on a price basis and will likely lead to further hits to rural economies. [Link]
Startup Claims Breakthrough in Long-Duration Batteries by Russell Gold (WSJ)
While Form Energy’s iron-air batteries won’t be used to power cars or smartphones, they do have potential to discharge at high loads for a prolonged period and are very cheap, which makes them a very attractive candidate for utility-scale storage of wind or solar power produced at low cost. [Link; paywall]
Are Wind Turbines a Danger to Wildlife? Ask the Dogs. by Sarah Zhang (The Atlantic)
Onshore wind turbines kill lots of birds and bats, and figuring out what the numbers look like is a lot easier when dogs get involved in the search for winged victims. [Link]
Labor Markets
Let me work from home, or I will find another job by Jose Maria Barrero, Nicholas Bloom, and Steven J. Davis (Working Paper)
While it’s not clear just how many companies will fully embrace remote work, this paper makes a compelling case that workers vastly prefer “hybrid” arrangements, enough to switch jobs if given the chance. [Link; 8 page PDF]
The Noncompete Clause Gets a Closer Look by Lauren Weber (WSJ)
The Biden Administration has prompted a review of noncompete clauses, which can reduce worker mobility and prevent them from finding higher-wage work at a competitor. [Link; paywall]
Early impacts of the expiration of pandemic unemployment insurance programs (Arindrajit Dube)
An early review of the 25 states which have reduced pandemic unemployment insurance programs suggests that while they have reduced the UI benefit rolls, they have not led to any measurable impact on employment rates. [Link]
Chipotle, Target use TikTok to find the workers they need in tight job market by Susan Caminiti (CNBC)
Major corporations are working with Tiktok Resumes, a new service that allows candidates to submit video resumes rather than the more traditional one-pager. [Link]
Now Hiring: White Castle—Four Years After You Applied by Te-Ping Chen (WSJ)
Companies are reaching deep into their inboxes looking for people to work, in some cases years after the applicants initially reached out. [Link; paywall]
Deutsche Fehler
Deutsche Bank Enabled ‘Massive’ U.S. Ponzi Scheme, Lawsuit Says by Steven Arons (Bloomberg)
A suit alleges that the German lender helped facilitate a Ponzi scheme run out of two Cayman funds which ended up costing investors hundreds of millions. [Link; soft paywall]
The German Experiment That Placed Foster Children With Pedophiles (The New Yorker)
It’s hard to summarize the various strands of post-Nazism national guilt, misguided efforts at liberation, and pedophilic predation that tie this long story together, but the result is both horrifying and enthralling. Content warning: this article discusses child abuse of various types. [Link]
Barmy Britain
Eric Clapton Says He Won’t Play Venues That Require Proof of Vaccination by Ethan Shanfeld (Yahoo!/Variety)
British singer Eric Clapton is so opposed to vaccination that he won’t play at convert venues which require vaccination from attendees. [Link]
Peppa Pig, a Pandemic Favorite, Has American Children Acting British by Preetiuka Rana and Meghan Bobrowsky (WSJ)
American children are watching so much of the popular British cartoon that they’re developing British accents and using British vocabularies. [Link; paywall]
Bitcoin
Viral video shows Malaysian police destroying 1,069 bitcoin mining rigs with a steamroller by MacKenzie Sigalos (CNBC)
In Malaysia, a local police department seized over 1,000 bitcoin mining rigs that had been running on stolen electricity. [Link]
Supply Chains
Taco Bell warns of menu disruptions caused by shortage of ingredients by Lexi Lonas (The Hill)
Transportation bottlenecks are fowling the delivery system which makes sure you can get a delicious Crunchwrap Supreme whenever you like. [Link]
Read Bespoke’s most actionable market research by joining Bespoke Premium today! Get started here.
Have a great weekend!
The Bespoke Report – Stocks Immune To Delta Diagnosis
This week’s Bespoke Report newsletter is now available for members.
Stocks roared back to an all-time high close this week, shrugging off a surge in Delta variant cases in the US and around the world. We dive deep into earnings results that continue to run far ahead of analyst estimates, which have no doubt helped stocks recover from their slip last week. In addition to detailed analysis of how US earnings are rolling in, we review major reports from Europe this week as well as previewing major reports from both sides of the Atlantic next week. Fund flows continue to run at a shocking pace, driven by massive buying of bond funds and big inflows to equities too, while the longest commodity bear market in history continues despite 52 week highs for commodities this week. We discuss what high commodity prices mean for equities, as well as reviewing the recent slide in the crypto space. Finally, we review some big housing market data reports this week and take a look at which sectors of the economy are saving too much or too little. To read the report and access everything else Bespoke’s research platform has to offer, start a two-week free trial to one of our three membership levels.


Daily Sector Snapshot — 7/23/21
Europe Back on the New High List
It has been a period of sideways trading right near record highs for European equities since mid-June. After a break below its 50-day moving average and an apparent break of its uptrend, European equities were quick to rebound and this morning are trading right at record highs once again.

While European equities are right back at record highs this morning, from the perspective of a US investor, the picture doesn’t look nearly as bright. After a gap lower right after it traded at its last record high in mid-June, the STOXX 600 in dollar adjusted terms was hugging its 50-DMA for more than a month before breaking down earlier this week. And while the STOXX 600 was quick to rebound back above its 50-DMA in local currency terms, on a dollar adjusted basis, it hasn’t gotten there yet.

Obviously, the key culprit in the divergence between the performance of the two indices is the dollar. As shown in the chart of the US Dollar Index below, the last time the STOXX 600 was hitting new highs in mid-June, the dollar was right near 52-week lows. After the June FOMC meeting, though, the Dollar spiked higher and has continued climbing ever since, and that is clearly acting as a weight on the performance of US investors’ international investments. Click here to view and try out Bespoke’s premium membership options where we cover both US and international market developments.

Bespoke’s Morning Lineup – 7/23/21 – In Like a Bear, Out Like a Bull
See what’s driving market performance around the world in today’s Morning Lineup. Bespoke’s Morning Lineup is the best way to start your trading day. Read it now by starting a two-week free trial to Bespoke Premium. CLICK HERE to learn more and start your free trial.
“We don’t get paid for activity, just for being right. As to how long we’ll wait, we’ll wait indefinitely.” – Warren Buffett
What a difference a few days makes. While the week started off with major concerns regarding the Delta variant, three straight positive days and an up morning in the futures market later, and the Delta variant is the last thing on investor’s minds. Strong earnings in the social media space, as well as earnings from American Express (AXP), are pushing futures higher while disappointing results from Intel (INTC) and Boston Beer (SAM) have been set aside. As far as the social media sector is concerned, the solid results from Snap (SNAP) and Twitter (TWTR) have pushed the market cap of SNAP up above $100 billion while Facebook (FB) now finds itself back in the trillion-dollar club.
Read today’s Morning Lineup for a recap of all the major market news and events from around the world, the latest US and international COVID trends including our vaccination trackers, and much more.
As we head into the weekend, we wanted to provide a quick snapshot of some of the major US indices across various market cap ranges. Starting at the low end, small caps plunged earlier this week to multi-month lows before regaining steam in the middle of the week. On Thursday, the Russell 2000 was once again the notable laggard maintaining what has been a string of lower highs and lower lows for the last several weeks. For now, the Summer weakness continues to be noise within a multi-month period of consolidation, but there has been increasing pressure on small caps.
Like small caps, mid-caps have also been laggards for the last several months. As proxied by the S&P 400 Mid Cap Index, we have seen a steady string of lower highs and lower lows since its peak in late April. The index is finishing the week well off its lows, but the downtrend remains in place.
Moving up to the market cap spectrum, large caps have been the area of most strength. As shown by the Nasdaq 100 and S&P 500, both indices have patterns that are as far from downtrends as could be possible. In fact, if the current levels in the futures market hold, both of them will be close to all-time highs.

Bespoke’s Asset Class Performance Matrix
Below is a look at week-to-date, quarter-to-date, and year-to-date performance numbers across asset classes using US-listed ETFs. While this week started off with a big drop for stocks on Monday, equities have bounced back nicely and are sitting on WTD gains of ~1%. The Nasdaq 100 (QQQ) and Russell 2,000 (IWM) are up the most on the week, but IWM remains down 4.7% on the month and up 11.8% on the year. That 11.8% YTD gain is the weakest of the main US index ETFs.
Growth ETFs are outperforming value ETFs this week, and the DJ Dividend ETF (DVY) remains down 0.8% on the week. Even with this week’s declines, DVY has been one of the best style ETFs on a year-to-date basis. Looking at sectors, the two main defensives (Utilities and Consumer Staples) are still in the red this week, and they’re up less than any other sectors on the year. Consumer Discretionary (XLY) and Technology (XLK) have done the best this week, while their YTD returns sit right in the middle of the pack. Energy (XLE) and Financials (XLF) remain the two best sectors on the year even though they’ve been consolidating for the past couple of months.
Outside of the US, we’ve seen the biggest gains for Canada (EWC) and Spain (EWP) this week, while Brazil (EWZ) and Mexico (EWW) are the two countries furthest in the red. While the developed world ETFs (EFA, IOO, CWI) are up this week, emerging markets ETFs like EEM and BKF are down. In terms of YTD performance, the Global 100 (IOO) is handily outperforming emerging markets (EEM).
In the commodity space, the natural gas ETF (UNG) is up sharply this week with a gain of 8.7%. This week’s gains have boosted UNG’s YTD move above the 50% mark. The oil ETF (USO) is up the second-most on the year of the commodity ETFs listed with a gain of 48.95%. The broad commodities ETF (DBC) is also up sharply on the year at +29.6% even though the two main precious metals (GLD, SLV) are down 4-5%.
The two main crypto exchange-traded products — GBTC and ETHE — have finally bounced a bit this week with gains of 3-4%. They’re still solidly red on the month, although ETHE is still up 19.4% on the year. GBTC, on the other hand, remains down 15.5% year-to-date. Start a two-week trial to Bespoke Premium if you’d like to read our weekly Bespoke Report newsletter published every Friday afternoon.
