Maybe GameStop (GME) Should Stop Reporting Earnings Altogether
If there were a high scorer list in terms of stock performance since the start of 2020, the letters “GME” would be near the top. One hundred dollars worth of GameStop (GME) at the start of 2020 would currently be worth $2,925!

Today, though, shares of GME are trading down over 7% following a disappointing earnings report after the close yesterday. Given the performance of GME since the start of 2020, you would think that a day like today where the stock trades sharply lower in reaction to earnings would be an outlier. Hardly. Following its six prior earnings reports since the start of 2020 leading up to today, GME has traded lower on its earnings reaction day five times for an average decline of over 16%. The only positive reaction the stock has had in reaction to earnings during this period was a 2.2% gain in June 2020. In fact, going all the way back to September 2018, that June 2020 gain was the only positive earnings reaction day for the stock. How bad have earnings reports been for GME’s stock since the start of 2020? While $100 in GME stock since the start of 2020 is worth nearly $3,000 today, if you only had exposure to the stock on the day of each of its earnings reaction days during this period, that $100 would be worth less than $30 today!
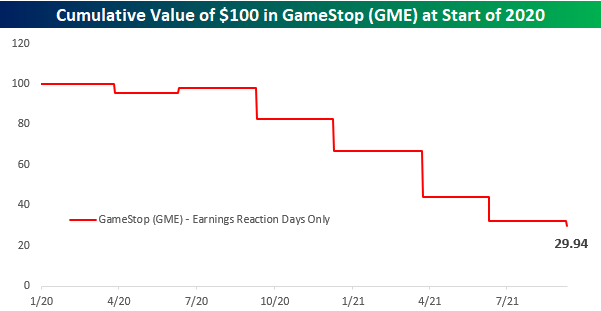
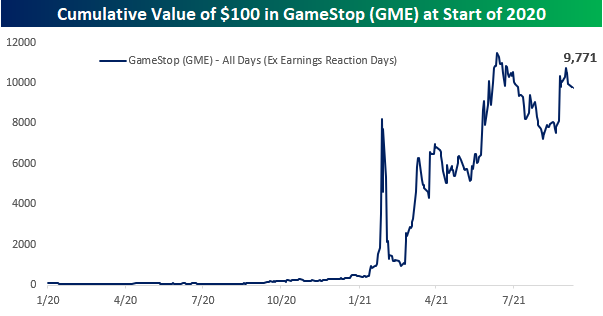
The cumulative effect of GME’s weak reaction to earnings also shows up if you look at its cumulative performance since 2020 and excluding the trading days following GME’s quarterly earnings reports. Not including those seven trading days, $100 worth of GME at the start of 2020 would be worth nearly $10,000 today! Following its earnings conference call after the close yesterday, GME management was criticized for not taking any questions and providing little insight into its strategy moving forward. Based on how the stock has historically reacted to earnings, though, management probably wishes they could just do away with the whole earnings process entirely. Click here to view Bespoke’s premium membership options.
August 2021 Headlines
Ida Impacts Claims
Last week’s initial jobless claims number was revised higher by 5K to 345K. Partially thanks to that upwards revision and a big drop this week, claims fell by 35K for the biggest one-week decline since the last week of June. That sizeable decline brings initial claims to the lowest level of the pandemic at 310K on a seasonally adjusted basis.

On a non-seasonally adjusted basis, claims are actually below 300K as has been the case for the past three weeks now. This week marked the seventh in a row that unadjusted regular state claims have fallen week over week making for the longest stretch of consecutive declines in the number since a 13-week long run ending in the first week of July last year. Factoring in Pandemic Unemployment Assistance (PUA), claims totaled a pandemic low of 380.5K thanks to a drop back below 100K by the PUA program. With that said, the program is also nearing its end.
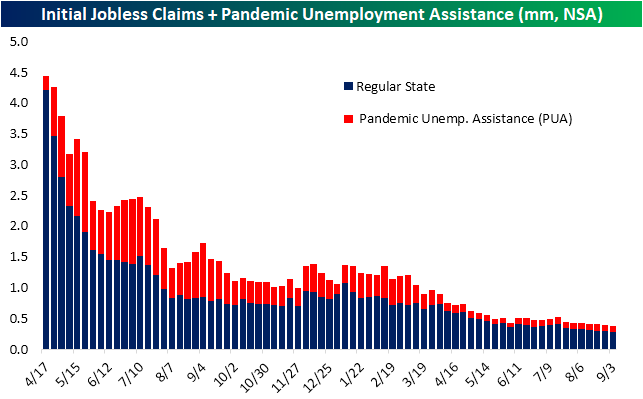
Lagged an additional week to the initial claims number, continuing claims also set a new low this week. Through the final week of August, continuing claims dropped for a second week in a row to 2.783 million (2.74 million expected) from 2.8 million the prior week. That reading is roughly 1 million above the pre-pandemic reading (1.784 million on March 13, 2020.

There is yet another week of lag to the data when all programs are included. Factoring in all auxiliary programs, the most recent data is through the week of August 20th. Total claims for that week were still above the low of 11.8 million from the last week of July, but they did cross back below 12 million. The biggest contributors to that decline were PUA claims which fell by 322.7K to 5.051 million and regular state claims which fell by 135K. Other programs, namely extended benefits, weighed on claim counts. The extended benefits program has been notably volatile over the past few months now, and that continued in the most recent week of data. The program rose from a near pandemic low of 114.4K to 311.3K which is at the upper end of the past several months’ range.

One other interesting point to note on this week’s claims data was the impact of Hurricane Ida. Regular state claims fell by 8K nationally on a non-seasonally adjusted basis this week, and that count would have been much better without the epicenter of recent hurricane news: Louisiana. With the state still recovering from the storm, claims more than quadrupled this week. In fact, the increase was even larger than that of the most populous state, California, which saw claims rise by 5.6K. Click here to view Bespoke’s premium membership options.

Chart of the Day: Weekday Wandering
Bespoke’s Morning Lineup – 9/9/21 – Four in a Row?
See what’s driving market performance around the world in today’s Morning Lineup. Bespoke’s Morning Lineup is the best way to start your trading day. Read it now by starting a two-week trial to Bespoke Premium. CLICK HERE to learn more and start your trial.
“Today I will do what others won’t, so tomorrow I can accomplish what others can’t” – Jerry Rice
It’s not often that you see the S&P 500 on pace for its fourth straight down day and it’s still within 0.6% of an all-time high, but it’s been a rather listless market in the days straddling the Labor Day weekend. The economic calendar is light again today with Jobless Claims the only report on the calendar. While the earnings calendar is light today, we’re currently in a relatively busy time of year when it comes to investor conferences, so there’s always the chance that a company drops a surprise at one of these conferences. Today, some of the more notable conferences are the Morgan Stanley Health Care Conference, Barclays Energy Conference, and the Deutsche Bank Technology Conference. In Europe, the ECB just announced its latest policy decision, and while rates were left unchanged, the central bank did take a moderately hawkish tone at the margin by announcing that it would conduct bond market purchases at a ‘moderately lower pace’ than recent activity.
In economic news, both initial and continuing jobless claims came in at post-COVID lows.
Read today’s Morning Lineup for a recap of all the major market news and events from around the world, including the latest US and international COVID trends.
One notable trend in this morning’s corporate announcements comes from the airline sector as not one, not two, and not three, but four different airlines have hit the tape this morning to lower Q3 guidance citing weakness related to the uptick in COVID cases (actually make that five as Delta just recently hit the tape as well). As one might expect after a company lowers guidance, all four stocks are trading moderately lower on the news. While the airline companies are just announcing the news of softer demand and a higher rate of cancellations, their stocks have been telling us this for months. Take a look at the charts below. All four have been in steady downtrends all summer.

Start a two-week trial to Bespoke Premium and read today’s full Morning Lineup.
Daily Sector Snapshot — 9/8/21
Chart of the Day: Intraday Market Action
S&P 5%+ Rallies and Declines
We’ve heard a lot lately about the steadiness of the S&P 500’s rally over the last year. And steady it has been. As shown below, it has now been 307 calendar days since the S&P 500’s last 5%+ pullback. Over this time period, the index has rallied 38.75%.

While 307 days without a 5%+ drop may seem like a long time, we actually just experienced a streak that was nearly twice as long from mid-2016 through early 2018. As shown below, that streak from 6/27/16 through 1/26/18 lasted 578 calendar days and saw the S&P gain 43.6%.
There have been three other streaks of 500+ days without a 5%+ decline in the S&P’s history. The longest streak lasted 593 days from December 1957 through August 1959. During that time period, the S&P rallied 54.16%. The other two 500+ day streaks ran from November 1963 to May 1965 (538 days) and December 1994 to May 1996 (533 days).
The current streak of 307 days without a 5%+ pullback ranks as the 13th longest on record. It has been a good run, but it’s certainly not unprecedented either. Click here to view Bespoke’s premium membership options.

Bitcoin Seasonality – Following a Different Path
September has historically been a weak time of year for the stock market, but with the growing popularity of crypto-currencies, we wondered what the seasonal trends have historically been for bitcoin. The chart below shows a composite of bitcoin’s median YTD performance over the last ten years for every day of the year. Generally speaking, bitcoin has started off the year slowly. Based on the last ten years, its median performance during the first quarter of the year has basically been flat but then starts to accelerate to the upside in Q2. Strength has generally continued in the first half of Q3, but then the period from mid-August through mid-October has been the weakest time of the year when bitcoin’s median YTD change falls from over 120% to below 85%. While Q4 has historically tended to start off slow, the year has typically finished on a high note with steady gains from late October through year-end.

In terms of consistency, the chart below shows the percentage of time from every calendar day of the year that bitcoin has experienced positive returns over the following month (four weeks). Historically speaking, from 2011 through 2020, bitcoin experienced positive one-month forward returns the most frequently right around tax day as it traded higher from 4/14 over the following four weeks in all ten years. As for the current period of the year (second red dot in the chart), in the four-week period following 9/8, bitcoin has had positive returns 60% of the time.

Whenever we discuss market seasonality, we always stress that historical patterns should only be used as a guide. Just because something happened one way in the past doesn’t mean it will follow the same pattern in the future. Along these lines, bitcoin’s performance in 2021 is a perfect example of not following the historical pattern. The chart below is the same as the one above, but it also includes bitcoin’s performance so far in 2021. Compared to the historical pattern, bitcoin’s performance in much of 2021 has been nearly the exact opposite. Rather than starting off the year flat, bitcoin came out of the gate strong in 2021 and more than doubled before the end of Q1. Beginning in mid-April, when bitcoin has historically seen the highest consistency of positive returns over the next month, its price peaked and quickly gave up most of its YTD gains. In mid-July, bitcoin’s price finally bottomed out and started to rally right up through Labor Day weekend when it briefly traded above 50K before falling over 10%. If there’s ever a time of year when bitcoin bulls don’t want bitcoin to follow the seasonal script, it’s the next few weeks. Click here to view Bespoke’s premium membership options.

Bespoke’s Morning Lineup – 9/8/21 – Mixed Market
See what’s driving market performance around the world in today’s Morning Lineup. Bespoke’s Morning Lineup is the best way to start your trading day. Read it now by starting a two-week trial to Bespoke Premium. CLICK HERE to learn more and start your trial.
“A government big enough to give you everything you want is a government big enough to take from you everything you have.” – Gerald Ford
Labor Day is supposed to mark the unofficial end to summer and the time when people return to work from Summer vacations, but the second trading day of the holiday-shortened week is looking like another quiet one. Futures are indicated lower following a weak session in Europe, but here in the US, the only economic report on the calendar today is the JOLTS report, which is expected to show slightly more than 10 million job openings. In earnings news, the only reports of note are Lululemon (LULU), RH, and Gamestop (GME).
Read today’s Morning Lineup for a recap of all the major market news and events from around the world, including the latest US and international COVID trends.
After Tuesday’s mixed start to the week, the technical picture for the major US indices remains mixed.
In the small-cap space, the Russell 2000 remains stuck in its range. After bouncing for a fourth time right around the $210 level, IWM has taken a pause in the last few days as it tries to digest its late August gains. If you’re bullish on small caps going forward, you’ll really want to see IWM quickly break the string of lower highs.
The Nasdaq 100 (QQQ) was the star of the show yesterday as it managed to eke out gains on an otherwise weak day for equities. With the recent upside, QQQ has become a bit extended as it breaks above its uptrend. The setup for the S&P 500 looks similar to the Nasdaq 100, but unlike QQQ, SPY stalled out just as it bumped up against that trendline resistance.

Start a two-week trial to Bespoke Premium and read today’s full Morning Lineup.