The Bespoke 50 Growth Stocks – 9/30/21
Bespoke’s Morning Lineup – 9/30/21 – Futures Off Highs Again
See what’s driving market performance around the world in today’s Morning Lineup. Bespoke’s Morning Lineup is the best way to start your trading day. Read it now by starting a two-week trial to Bespoke Premium. CLICK HERE to learn more and start your trial.
“If you don’t have a competitive advantage, don’t compete.” – Jack Welch
Futures are higher this morning heading into the opening bell, but they’re off their highs of the overnight session, and if you are sensing a pattern of overnight strength in futures with weakening towards the opening bell, you’re not imagining it. Today marks the last trading day of the quarter and bulls will be happy to see the month come to an end.
Between now and the closing bell, though, there’s a good deal of economic data on the calendar including jobless claims, GDP, Personal Consumption, and Chicago PMI. Jobless claims came in higher than expected on both an initial and continuing basis while revised GDP and Personal Consumption both modestly topped forecasts.
One piece of positive non-economic news concerns COVID trends in the United States where case counts, hospitalizations, and deaths continue to roll over.
Read today’s Morning Lineup for a recap of all the major market news and events from around the world, including the latest US and international COVID trends.
It’s been an especially rough week so far for the Nasdaq 100, and the index of large-cap tech-like stocks is down nearly 4% in just the first three trading days of the week. At the other end of the market cap spectrum, small caps have held up considerably better as the Russell 2000 is down just 1%. Below we show the relative strength of the Nasdaq 100 (QQQ) versus the Russell 2000 (IWM) since the start of 2020 where a rising line indicates outperformance of QQQ. Towards the right side of the chart, you can see the recent weakness in the Nasdaq 100 showing up in the chart as its relative strength versus small caps peaked in late August. You’ll notice that we saw a similar pattern play out last year where the Nasdaq 100’s relative strength peaked at the start of September before beginning a six-month slide relative to small caps. That period of underperformance for QQQ last year followed an insane period of outperformance earlier in the year. This year also saw a period of strong (but not as strong as in 2020) outperformance on the part of QQQ relative to small caps throughout the late spring and early summer, so small caps are certainly due for some catch-up, but one key difference between this year and last is that the fiscal and monetary backdrop is currently much less accommodative now than it was in late 2020.

Start a two-week trial to Bespoke Premium and read today’s full Morning Lineup.
Daily Sector Snapshot — 9/29/21
B.I.G. Tips – October, Q4 Seasonality
How Has the 10 Year Yield Historically Correlated to Growth Stock Performance?
Recently, all it seems investors can talk about is the relationship between the performance of growth stocks and interest rates. The general idea is that rising yields have a negative impact on the performance of growth stocks as the risk-free rate of return increases and future cashflows for high-growth companies are discounted at a higher rate. To highlight this relationship, today we wanted to take a look at a comparison between the relative strength of the Vanguard Mid Cap Growth ETF (VOT) versus the Vanguard Value ETF (VOE) versus the yield on the 10-year US Treasury.
Looking first just at the relationship between the two this year, the chart below shows the relative strength of growth vs value (blue line) compared to moves in the 10-year US Treasury (red line). When the blue line is rising, it indicates that growth stocks are outperforming value and vice versa. For pretty much the entire year, when yields have moved higher, growth stocks have underperformed, but when yields have pulled back, growth stocks start to lead the market. Over the last several days, the inverse relationship has been even more pronounced where the two lines have completely moved in the opposite direction. For this year at least, higher interest rates have been kryptonite for growth stocks.

The chart below is the same as above but goes all the way back to 2010 instead of just this year. Looking at the chart, while there were periods of inverse correlation in the early and mid-2010s, the trend really didn’t fully take hold until late 2018/early 2019. Since then, when rates have fallen, growth has outperformed and vice versa.

The inverse correlation has reached extreme levels this year. The chart below shows the correlation coefficient between the daily ratio of the VOT (mid-cap growth) versus VOE (mid-cap value) versus the yield on the 10-year US Treasury. Since 2010, there have been five years where the correlation coefficient was positive and in only three of those years was the positive reading anything more than negligible (2012, 2015, and 2018). In each of the past three years, what we’ve seen is the inverse correlation only intensify. Back in 2019, the only other year before that where the inverse correlation was more pronounced was in 2016, but then 2020 saw what was at the time the most inverse correlation since 2010. Based on this year’s relationship, though, 2020’s record may not last long. Through Tuesday’s close, the correlation coefficient between the relative strength of growth stocks and the 10-year yield was -0.87. While the inverse relationship between growth stock performance and interest rates may not continue to be as pronounced as it is now in the future, any continued increase in long-term interest rates is likely to act as a headwind for the performance of growth stocks. Click here to view Bespoke’s premium membership options.

Chart of the Day – Breadth Extremes
Bespoke’s Morning Lineup – 9/29/21 – Futures Bounce But Off Earlier Highs
See what’s driving market performance around the world in today’s Morning Lineup. Bespoke’s Morning Lineup is the best way to start your trading day. Read it now by starting a two-week trial to Bespoke Premium. CLICK HERE to learn more and start your trial.
“Individuals who cannot master their emotions are ill-suited to profit from the investment process.” – Benjamin Graham
It was looking like a bounceback Wednesday for equities earlier, but futures have been drifting lower over the last couple of hours. As things currently stand, futures are indicating a positive open, but the magnitude of the gains have been more than cut in half. There’s not a lot of data on the calendar today as the only report scheduled for release is Pending Home Sales at 10 AM. The yield on the 10-year was below 1.5% earlier but has also drifted back above that level as equity futures have pulled back.
Read today’s Morning Lineup for a recap of all the major market news and events from around the world, including the latest US and international COVID trends.
Given the weakness to start this week, it may sound hard to believe but the S&P 500 closed yesterday essentially where it closed last Tuesday. In other words, there’s been a lot of noise in day-to-day moves over the last five trading days, but the equity market has nothing to show for it in either direction. At the sector level, though, returns have been anything but flat. As shown in the snapshot below from our Trend Analyzer, all eleven sector ETFs have seen moves up or down of at least 0.69% over the last week, and all but two have moved up or down at least 1%.
Those figures don’t even fully describe the magnitude of sector moves over the last week. At the bottom end of the performance spectrum, interest rate-sensitive sectors like Utilities and Real Estate are both down over 3% while Health Care and Technology are each down more than 1%. At the other end of the spectrum, five out of eleven sectors are actually up more than 1% over the last week, including Energy which has surged more than 11% and Financials which is up over 4%. Along with those two sectors, other cyclically oriented sectors like Materials, Industrials, and Consumer Discretionary are all up over 1%. Performance over the last week has really been a function of which sectors an investor has been over or underweight

Start a two-week trial to Bespoke Premium and read today’s full Morning Lineup.
B.I.G. Tips – 2% Drops
Daily Sector Snapshot — 9/28/21
Richmond Back in the Red
The fifth and final manufacturing survey for the month of September from the regional Federal Reserve banks was released this morning, and it did not end the month on a high note. The Richmond Fed’s headline reading fell into contractionary territory this month for the first time since May 2020 as the index dropped 12 points month over month falling from +9 down to -3. Relative to all the other regional Fed reports, Richmond only Richmond reported contraction in September.
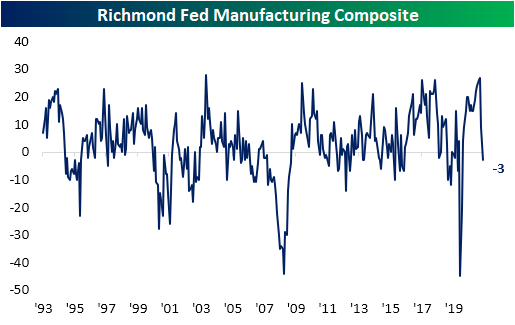
The 12 point decline month over month in the headline reading was significant ranking in the bottom 5th percentile of all monthly moves. But it was actually a smaller decline than last month when the index dropped 18 points. Regardless, the 30-point combined decline over the past two months is the second largest on record behind the 38 point drop in April of last year.
Factoring into that headline weakness, most of the categories of the report were also lower month over month. Given those declines, most readings are also now in the bottom end of their historical ranges with some exceptions. Order Backlogs, Vendor Lead Times, Equipment and Software Expenditures, Employees, Wages, and price indices are all still in the upper decline of readings.
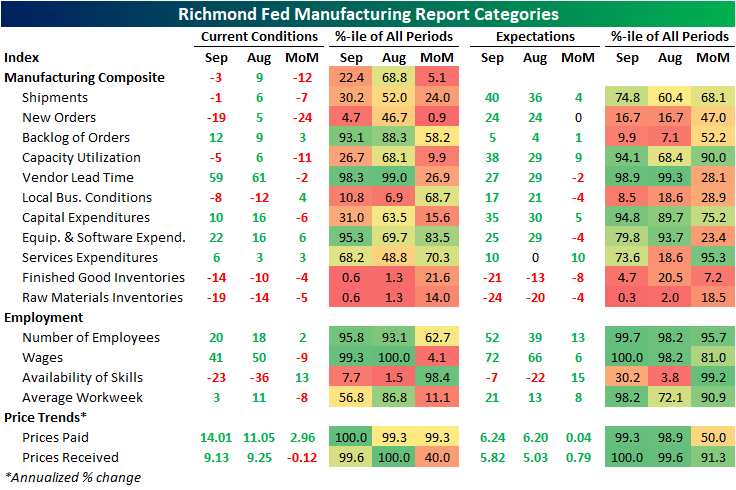
By far the largest decline in September was for New Orders. That index plummeted 24 points versus August for the fourth-largest decline on record and putting the index in the bottom 5% of its historical range. In other words, demand slammed on the brakes in September. In spite of that decline, expectations have held up relatively well at 24; unchanged month over month. Shipments also fell into contraction albeit less dramatically. Meanwhile, Vendor Lead Times improved as the index fell 2 points, but that remains an extremely elevated reading indicating continued pressures on supply chains.

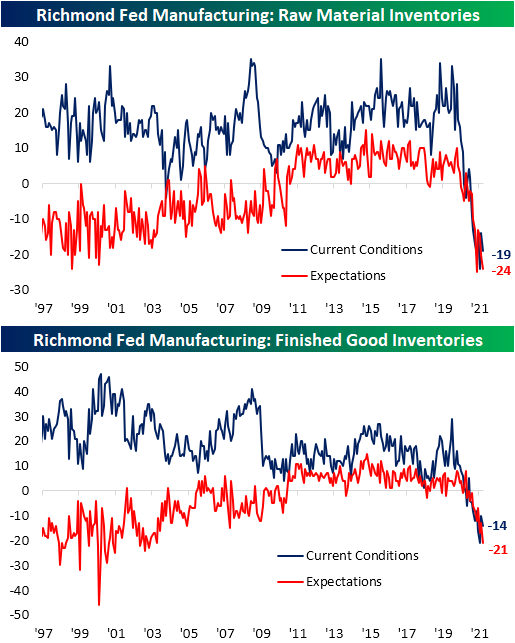
One potential reason for shipments having pulled back is a complete lack of inventories. Both readings on raw materials and finished good inventories fell month over month and are at historically depressed levels across both current conditions and expectations.
Indices tracking employment were perhaps the healthiest area of the report. The index tracking the Number of Employees edged higher to 20 while expectations saw an even larger jump, stopping just short of a record high. Wages, meanwhile, declined 9 points from a record high. That reading is still the third-highest on record, though, and expectations were at a record high. While the Average Workweek index was also lower MoM, there has been another improvement in the number of firms reporting a lack of availability of skilled workers.

The other area of the report to touch records this month concerned prices. Prices paid came in at a new high with prices increasing 14% annualized. Prices Received were slightly lower at 9.13%, but that is well above other readings throughout the survey’s history and the expectations index set another record. Click here to view Bespoke’s premium membership options.
