The Bespoke Report Newsletter – 11/5/21 – Shock & Supply: Energy, Capex, Labor, & Inflation In Q4
This week’s Bespoke Report newsletter is now available for members.
This week’s Bespoke Report is our Macro Quarterly summary of big trends from around the global economy and financial markets. We review recent policy decisions from the Fed and other global central banks, the recent massive shocks to energy markets and what comes next for those commodities, supply shortages in other contexts…and how the global economy may respond to these large swings driven by changing consumer demand, policy stimulus, and the COVID pandemic. We also review October labor market data from the BLS’ employment situation report, and the current high-level backdrop for US equity markets.
To read this week’s full Bespoke Report newsletter and access everything else Bespoke’s research platform has to offer, start a two-week trial to one of our three membership levels.


Bespoke’s Morning Lineup – 11/5/21 – Semi-Important Jobs Days
See what’s driving market performance around the world in today’s Morning Lineup. Bespoke’s Morning Lineup is the best way to start your trading day. Read it now by starting a two-week trial to Bespoke Premium. CLICK HERE to learn more and start your trial.
“I don’t mind going back to daylight saving time. With inflation, the hour will be the only thing I’ve saved all year.” – Victor Borge
First things first. Don’t forget to set your clocks back Saturday night before going to bed. Now, on to the markets. Futures are higher again this morning as the S&P 500 looks to close out a perfect week with record closing highs every single day. Last night was a busy one for earnings, so the positive tone in futures suggests that despite some misses, investors were pleased with what they heard. Now the focus shifts to the October jobs report where economists are expecting just over half a million new jobs. The last two reports have had some pretty significant misses relative to expectations, so we’ll see if the trend breaks this month.
Read today’s Morning Lineup for a recap of all the major market news and events from around the world, including the latest US and international COVID trends.
The performance of the semiconductor sector lately has been stunning. After successfully testing its 200-DMA in mid-October, the semiconductor sector ETF (SMH) has surged to record highs. More recently, the Philadelphia Semiconductor Index (SOX) has rallied more than 1% every day this week.

With just 36 prior streaks of four or more days in the last 25 years, these kinds of streaks don’t happen very often but they aren’t unprecedented. Streaks of five or more days are much more uncommon though. There have only been 12 prior streaks where the SOX was up 1%+ for five straight days. Currently, the SOX is indicated to open up about 0.60%, so an extension of the current streak to five can’t be ruled out at this point, although the jobs report will have a say in that. Moving on, there have only been four prior streaks where the SOX was up 1%+ for more than five straight days, and all of those streaks ended at six trading days.

Start a two-week trial to Bespoke Premium to read today’s full Morning Lineup.
Bespoke’s Weekly Sector Snapshot — 11/4/21
Chart of the Day: Pulse on Bitcoin
The Bespoke 50 Growth Stocks – 11/4/21
The “Bespoke 50” is a basket of noteworthy growth stocks in the Russell 3,000. To make the list, a stock must have strong earnings growth prospects along with an attractive price chart based on Bespoke’s analysis. The Bespoke 50 is updated weekly on Thursday unless otherwise noted. There was one change this week.
The Bespoke 50 is available with a Bespoke Premium subscription or a Bespoke Institutional subscription. You can learn more about our subscription offerings at our Membership Options page, or simply start a two-week trial at our sign-up page.

The Bespoke 50 performance chart shown does not represent actual investment results. The Bespoke 50 is updated weekly on Thursday. Performance is based on equally weighting each of the 50 stocks (2% each) and is calculated using each stock’s opening price as of Friday morning each week. Entry prices and exit prices used for stocks that are added or removed from the Bespoke 50 are based on Friday’s opening price. Any potential commissions, brokerage fees, or dividends are not included in the Bespoke 50 performance calculation, but the performance shown is net of a hypothetical annual advisory fee of 0.85%. Performance tracking for the Bespoke 50 and the Russell 3,000 total return index begins on March 5th, 2012 when the Bespoke 50 was first published. Past performance is not a guarantee of future results. The Bespoke 50 is meant to be an idea generator for investors and not a recommendation to buy or sell any specific securities. It is not personalized advice because it in no way takes into account an investor’s individual needs. As always, investors should conduct their own research when buying or selling individual securities. Click here to read our full disclosure on hypothetical performance tracking.
Sentiment Soaring Across Surveys
Major US indices have continued to press to new all-time highs, and this time around, that includes small caps. As such, sentiment has moved higher in tow with this week’s reading from the American Association of Individual Investors weekly sentiment survey showing the percentage of respondents reporting as bullish rising from 39.8% to 41.5%. While higher versus last week, that is only a modest recovery from last week’s 7.1 percentage point decline from the recent high of 46.9%. Overall, that reading points to a strong but far from historically extended reading on market optimism.

Bearish sentiment, on the other hand, has experienced more persistent declines. The percentage reporting as bearish fell to 26% this week which marks the lowest reading since the end of July when less than a quarter of respondents reported as such. As with bullish sentiment, that reading is by no means extreme only a few percentage points below the historical average.

Given the moves in bullish and bearish sentiment, the bull-bear spread ticked higher to 15.5 which again is stronger but not back up to the high from two weeks ago.
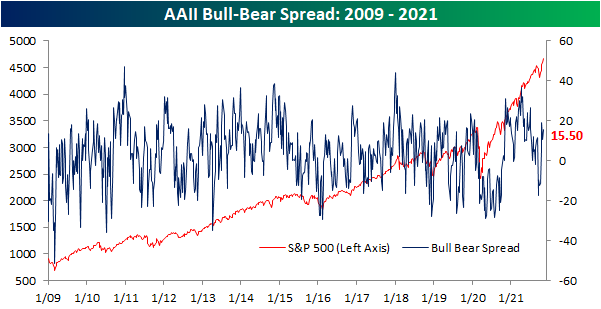
Neutral sentiment saw a decent sized 5.3 percentage point uptick last week. This week saw another, albeit smaller 1.8 percentage point uptick to 32.5% this week. Even more so than bullish and bearish sentiment, that leaves the reading essentially right in line with the historical average of 31.43%.

Again, the AAII’s survey has shown that sentiment has grown increasingly positive though it is not flying. Other sentiment readings are soaring though. For example, the National Association of Active Investment Managers’ Exposure Index has seen a sharp rise over the past few weeks with the past two seeing readings above +100. With regards to this index, readings above +100 indicate responding managers are reporting that they are fully invested long, +200 would indicate they are leveraged long, zero would be market neutral, -100 would be fully short, -200 would be leveraged short. This week marked the first back-to-back readings above +100 and the strongest levels since February of this year

In addition to those two indices, the Investors Intelligence survey also saw bullish sentiment rise to one of the strongest levels since the summer gaining double-digit percentage points in the past two weeks alone. In other words, across indicators on sentiment, there has been a notable uptick in bullishness over the past few weeks. To quantify this across indicators, below we created a composite index of the three surveys. This composite shows the average standard deviation of each one from its historical average. As shown, this week’s uptick across indicators resulted in the composite moving into the upper decile of historical readings since 2006. Additionally, the increase in the past four weeks has been one of the largest in exactly two years with only a small handful of larger upticks going back to 2006 when the newest of these indicators—the NAAIM index—begins. Click here to view Bespoke’s premium membership options.

Claims Diverge From Seasonal Norms
Another week, another pandemic low for jobless claims with the seasonally adjusted initial reading falling to 269K. That compares to an upward revision to 283K last week and expectations of a decline to only 278K. At current levels, initial claims are now only y 13K above the levels the week of March 13, 2020; the last week before claims began to print in the millions.

On a non-seasonally adjusted basis, claims are also only slightly above those March 2020 levels falling another 7K to 240.2K this week. With the expiration of the program now in the rearview, PUA claims are down to negligible levels and are continuing to come in lower with this week only showing 2.2K claims.

When it comes to the unadjusted number, last week marked a third consecutive week of lower claims, and that is in the context of a longer stretch of declines. From the week of July 23rd to the end of October, there were only two weeks in which non-seasonally adjusted claims were higher week over week: September 17th and October 8th. While claims typically decline in late Summer, the continued declines into the fall are certainly unusual from a seasonal perspective. As shown below, from around the time of Labor Day through the end of the year, claims have historically seen a gradual move higher. But rapidly coming off of historic levels from the pandemic, that has not been the case in 2021 as this fall has seen a divergence from seasonal patterns.

Continuing claims have also continued to decline hitting pandemic lows. At 2.105 million through the week of October 22nd, claims are a few hundred thousand above the March 13, 2020 level of 1.784 million.

On a nonseasonally adjusted basis, regular state claims came in below 2 million for a second week in a row which hasn’t happened since December 2019. Additionally, at 1.889 million, claims are at the lowest level since December 2019. Factoring all other programs creates an additional week of lag making the most recent data through October 15th. Total unadjusted claims as of that week set another low of 2.68 million, down 159K from the prior week. Regular state claims were the main driver of that decline as PUA and Extended Benefits programs actually saw modest upticks. For PUA claims, that was the first higher reading on a week over week basis since the official expiration of the program in the first week of September, and it was the first uptick in the Extended Benefits program in five weeks. While that indicates a modest reversal of recent trends, it will likely prove to only be temporary as those programs are not supported to the same extent as they used to be. Click here to view Bespoke’s premium membership options.

Bespoke’s Morning Lineup – 11/4/21 – Jobless Claims Drop For 5th Straight Week
See what’s driving market performance around the world in today’s Morning Lineup. Bespoke’s Morning Lineup is the best way to start your trading day. Read it now by starting a two-week trial to Bespoke Premium. CLICK HERE to learn more and start your trial.
“The riskiest thing we can do is just maintain the status quo.“ – Bob Iger
Commodities are generally trading higher this morning, while treasury yields are lower. Equity futures are little changed but indicated higher as investors digest another busy batch of earnings reports since the close last night. Following the announcement of the taper yesterday afternoon, equities have taken the news, which was entirely expected, very well.
Economic data just released showed a larger than expected drop in initial and continuing jobless claims. Non-Farm Productivity was weaker than expected while Unit Labor Costs rose more than expected.
Read today’s Morning Lineup for a recap of all the major market news and events from around the world, including the latest US and international COVID trends.
Just like the US, stocks in Europe have consistently been hitting 52-week highs after breaking out above their Summer highs last week. Like the S&P 500, the STOXX 600 has been higher for five days in a row and is on pace for its sixth straight day of gains today. While the STOXX 600 has been performing in line with the S&P 500 on a nominal basis, after adjusting for the changes in the dollar, US stocks have been steadily outperforming in recent weeks. The chart below shows the relative strength of the S&P 500 vs the STOXX 600 (in dollar terms) over the last year. While stocks in Europe were outperforming the S&P 500 for the first half of 2021 (falling line in the chart below), ever since June, it has been US stocks that have been leading.

Start a two-week trial to Bespoke Premium to read today’s full Morning Lineup.
Daily Sector Snapshot — 11/3/21
Love For The Taper
In today’s Chart of the Day, we provided a rundown of the S&P 500’s historical intraday pattern on Fed days. Now that the trading day has come and gone, we have added today’s price action into the mix as well.
Below is a look at the average path that the S&P 500 has taken on Fed days since 1994 when the Fed first began announcing its policy decisions on the same day as its meeting.
For the entire data set of Fed days since 1994 (dark blue line), the S&P has historically trended higher throughout the day with only a small dip in the immediate aftermath of the 2 PM ET announcement.
Since Powell became Fed chair in early 2018, the intraday action has been quite a bit different (red line). Especially early on in Powell’s tenure, the S&P had a pattern of posting solid intraday gains prior to the 2 PM announcement but then trading sharply lower during the Fed press conference into the 4 PM ET close.
The opposite pattern emerged today. Instead of trading higher heading into the 2 PM announcement, the S&P was in the red all day leading up to the Fed release. At 2 PM when the Fed statement came out (including the official announcement of tapering asset purchases), the S&P got an initial jolt and traded into positive territory. Then when Powell’s presser began, the S&P saw another intraday jump and then it continued to rally into the close. Had Powell known that the taper would cause this type of reaction, maybe he would have done it sooner! Click here to view Bespoke’s premium membership options.
