Bespoke’s Morning Lineup – 11/19/21 – Lockdowns Make a Comeback
See what’s driving market performance around the world in today’s Morning Lineup. Bespoke’s Morning Lineup is the best way to start your trading day. Read it now by starting a two-week trial to Bespoke Premium. CLICK HERE to learn more and start your trial.
“Failure is simply the opportunity to begin again, this time more intelligently.” – Henry Ford
After the near-complete shutdown last year and the gradual re-opening of the economy in fits and starts around the world since then, most people probably thought we would never return to the days of lockdowns again, but Austria and other parts of Europe are changing that mindset this morning. In Austria, two regions of the country are locking down beginning on Monday by closing non-essential businesses and schools for a month. Whether these lockdowns extend to the entire country remains to be seen. Outside of Austria, parts of Germany have also announced that bars and restaurants will be temporarily closed in an effort to halt the spread. With case counts rising in other parts of Europe as well, a spread of these restrictions to other parts of Europe can’t be ruled out.
Not surprisingly, the new restrictions on activity being placed in Europe have put pressure modest pressure on equities in the region and here in the US this morning while treasury yields decline and crude oil is down sharply falling to its lowest level since October 1st. The weakness in equities this morning isn’t all one-sided, though. Re-opening stocks are under pretty significant pressure and the Russell 2000 is down over 1%, while ‘work from home stocks’ have been catching a bid with the Nasdaq indicated to open higher.
Read today’s Morning Lineup for a recap of all the major market news and events from around the world, including the latest US and international COVID trends.
The charts below are what have government officials in Europe and investors around the world on edge. Starting with Germany but spreading to other countries, COVID case numbers across major European economies have been surging in recent weeks. As shown in the chart at left, case numbers in Europe as a whole have been surging and are now well back above levels (per million people) in the US (where case levels have also started a new leg higher). Within the European continent (right chart), Germany has been leading the way higher in terms of total new case counts which are actually at a new high for that country, but if you look a little closer at the chart, you can also see that case numbers in France, Italy, Spain, and Sweden have also started to trend higher.

Start a two-week trial to Bespoke Premium to read today’s full Morning Lineup.
Bespoke’s Weekly Sector Snapshot — 11/18/21
The Bespoke 50 Growth Stocks – 11/18/21
The “Bespoke 50” is a basket of noteworthy growth stocks in the Russell 3,000. To make the list, a stock must have strong earnings growth prospects along with an attractive price chart based on Bespoke’s analysis. The Bespoke 50 is updated weekly on Thursday unless otherwise noted. There were no changes this week.
The Bespoke 50 is available with a Bespoke Premium subscription or a Bespoke Institutional subscription. You can learn more about our subscription offerings at our Membership Options page, or simply start a two-week trial at our sign-up page.

The Bespoke 50 performance chart shown does not represent actual investment results. The Bespoke 50 is updated weekly on Thursday. Performance is based on equally weighting each of the 50 stocks (2% each) and is calculated using each stock’s opening price as of Friday morning each week. Entry prices and exit prices used for stocks that are added or removed from the Bespoke 50 are based on Friday’s opening price. Any potential commissions, brokerage fees, or dividends are not included in the Bespoke 50 performance calculation, but the performance shown is net of a hypothetical annual advisory fee of 0.85%. Performance tracking for the Bespoke 50 and the Russell 3,000 total return index begins on March 5th, 2012 when the Bespoke 50 was first published. Past performance is not a guarantee of future results. The Bespoke 50 is meant to be an idea generator for investors and not a recommendation to buy or sell any specific securities. It is not personalized advice because it in no way takes into account an investor’s individual needs. As always, investors should conduct their own research when buying or selling individual securities. Click here to read our full disclosure on hypothetical performance tracking. Bespoke representatives or wealth management clients may have positions in securities discussed or mentioned in its published content.
Chart of the Day: Historical Returns The Week of Thanksgiving
Sentiment Back to Average
The past week has seen the S&P 500 hover right below but not at record highs. The lack of new highs in price appears to have left individual investors apprehensive as bullish sentiment in the AAII survey pulled back 9.2 percentage points to 38.8%. That was the biggest one-week drop since a 16.5 percentage point decline in the week of September 16th, though back then, bullish sentiment sat much lower at 22.4%. At the current level, bullish sentiment is still within one percentage point of the historical average.

While bullish sentiment saw a sharp reversal lower, bearish sentiment rose modestly to 27.2%. That is the highest level since the end of October and that remains roughly 3 percentage points below the historical average.
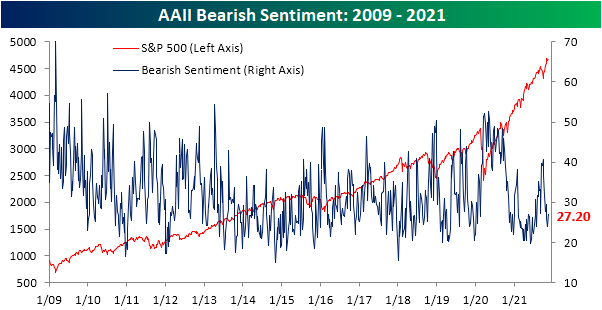
Those inverse moves resulted in the bull-bear spread falling to 11.6. While lower, that still indicates overall sentiment favors optimists.

A greater share of the losses to bullish sentiment shifted to the neutral camp with around a third of respondents reporting as such. That is the highest level since the first week of October. That reading is a few percentage points above the historical average meaning that like bullish and bearish sentiment, current survey readings do not indicate sentiment is elevated or depressed to any sort of notable extent. Click here to view Bespoke’s premium membership options.

Demand Surges in Philly
There were two regional Fed bank manufacturing survey results for the month of November released this morning. The first and stronger of these was out of the Philly Fed. Like the neighboring Empire Fed reading out earlier this week, the Philadelphia Fed’s survey showed an acceleration in activity this month that exceeded expectations. The index for General Business Conditions rose 15.2 points to 39.0 versus a more modest expected increase to only 24. That brings the index from a 79th percentile reading last month to a 96th percentile reading which is the strongest since April’s near-record level.
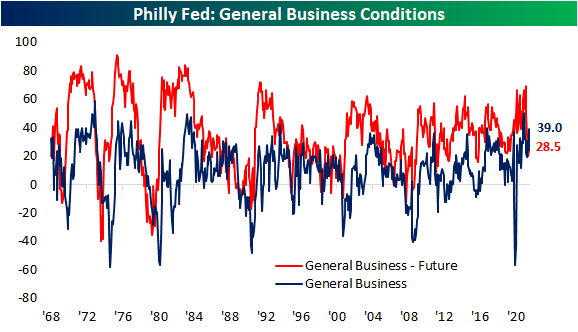
Not only was there a big increase in the headline number, but many of the other categories also saw significant increases this month including new orders, unfilled orders, and prices received which all saw month over month gains that rank in the roughly top 5% of each index’s respective history. Overall, the report showed continued growth in the region’s manufacturing economy with almost every category accelerating MoM in November.
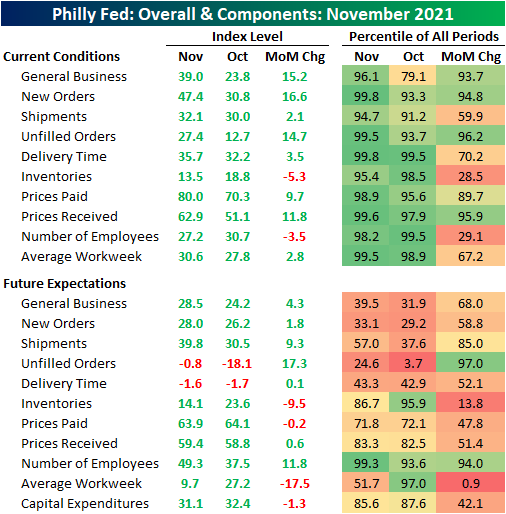
Demand saw massive improvement this month as the index for New Orders leaped higher by 16.6 points to 47.4. That leaves the index at the second strongest level on record behind March 1973. Shipments also rose but the increase was far more modest relative to gains for demand. As a result, Unfilled Orders are also surging. That index came in at the fourth-highest level to date with the only higher readings occurring in May of this year and January and March of 1973.

It isn’t a new story, but one headwind in spite of—or perhaps even partially because of—that strong demand is supply chain issues. Higher readings in the Delivery Times index imply that products take longer to reach their destination. As with other reports, this index has been coming in at unprecedentedly high levels for several months now, but the Philly Fed differs in that this summer saw a big reversal lower. The increase this fall has now given up most of those improvements. Additionally, expectations are fairly optimistic with two months of negative readings in a row.

One other impressive aspect of the surge in demand is it comes as prices were hiked at a historic rate. The Prices Received index rose to 62.9 which is the third-highest reading on record. The only months with higher readings were February and June 1974. Prices Paid also rose month over month, but that index came up short of a new high. Click here to view Bespoke’s premium membership options.

New Lows And Oddities for Jobless Claims
Jobless claims were slightly weaker in the most recent data released this morning. Expectations were calling for a drop to 260K, but instead claims only fell to 268K from last week’s 2K upwardly revised reading of 269K. Given that revision, claims have now fallen for seven weeks in a row with new lows for the pandemic. Initial claims are also now only 12K above the pre-pandemic reading of 256K from March 13, 2020; the last week before claims began to print in the millions.
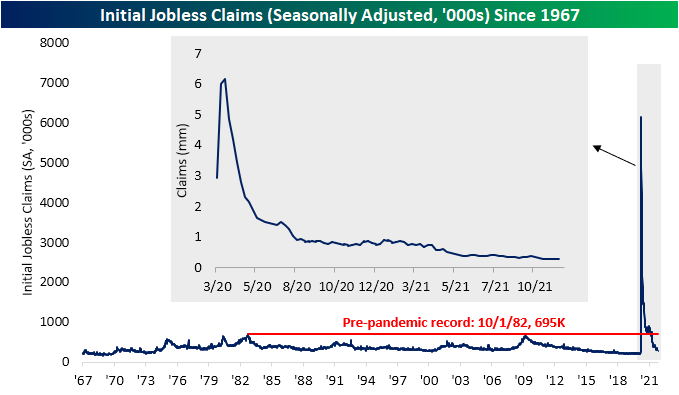
On a non-seasonally adjusted basis, that pre-pandemic low was finally taken out this week. Unadjusted claims totaled 238.9K from 257K last week. That is the lowest level since the first week of March 2020 when claims were a hair below 200K. With the program’s expiration now even further in the rearview, PUA claims continue to have a minimal impact of only 1,390.

From a seasonal perspective, 2021—particularly this fall—has been an interesting year. For starters, claims have more or less returned to historically normal levels even when factoring in auxiliary programs. Furthermore, from Labor Day through the end of the year has historically marked a period of the year that claims have had a tendency to rise, but this year the opposite has been the case. In the context of that bucked seasonal trend, the current week of the year (46th) actually has a seasonal tailwind with claims rising week over week only 16.67% of the time since 1967. In other words, this week’s drop could be expected but the new low it resulted in is thanks to seasonally unusual declines in weeks leading up to now.

Lagged one week to initial claims, continuing claims were the better part of the claims release. Continuing claims fell to 2.08 million versus expectations of a decline to 2.12 million from last week’s reading of 2.16 million. As with initial claims, that resulted in the strongest level for claims since March of last year when the reading sat below 2 million.

Using the non-seasonally adjusted data and including all other programs adds one more week of lag to the data making the most recent reading through the last week of October. The end of last month saw an uptick in claims across programs with the biggest contributor being PUA claims which rose by over half a million. At 791.1K, PUA claims were at the highest reading since the week of September 10th; right after pandemic programs expired.

While an uptick in PUA claims sounds puzzling given the program is expired nationally, delving deeper into the data shows the US uptick is all thanks to one state: California. As shown below, California has continuously made up for a large share of national PUA continuing claims since the start of the program. While the state has seen a substantial drop like the rest of the country this fall, this week’s rise leads California’s claims counts from this program to be a multiple larger than the 52 other states and territories combined. Click here to view Bespoke’s premium membership options.

Bespoke’s Morning Lineup – 11/18/21 – Philly Fed Jumps
See what’s driving market performance around the world in today’s Morning Lineup. Bespoke’s Morning Lineup is the best way to start your trading day. Read it now by starting a two-week trial to Bespoke Premium. CLICK HERE to learn more and start your trial.
“Trying to sell short in this market is like being run over by a train that’s going to derail a mile down the road.” – Julian Robertson
We may be at the tail end of earnings season, but it’s not going out quietly as we’re seeing some significant earnings-related moves this morning. On the downside, both Cisco (CSCO) and Alibaba (BABA) are down over 6% as they both missed sales estimates and lowered guidance. On the upside, even after the run it has had into earnings, Nvidia (NVDA) is up over 8%. In the retail space, a number of stocks including Victoria’s Secret (VSCO), Kohl’s (KSS), and Macy’s (M) are all up by at least 7%.
Today is also a fairly busy one for economic data as well with Jobless Claims and the Philly Fed at 8:30 and then Leading Indicators at 10 AM. Then, at 11 AM we’ll close out the week’s economic calendar (there are no reports scheduled for tomorrow) with the KC Fed r manufacturing report. Jobless Claims were pretty much right inline with expectations coming in at a post-COVID low of 268K while continuing claims were much lower than expected at 2.08 million. The Philly Fed report also came in better than expected coming in at a level of 39.0 which was the best reading since April.
Read today’s Morning Lineup for a recap of all the major market news and events from around the world, including the latest US and international COVID trends.
Relative to last Wednesday’s close, major US equity averages have generally had a positive bias but have seen little in the way of moves in either direction. As shown in our Trend Analyzer snapshot of US index ETFs, the only one that has moved up or down 1% during this period is the Micro-Cap index (IWC) with a decline of 1.17%. Despite the decline, though, IWC remains at overbought levels and is still one of the top-performing ETFs YTD. Behind IWC, the next worst performing index ETF in our snapshot is IWM which is down 0.9% over the last week. Like IWC and every other index ETF listed below, IWM remains at overbought levels, so it’s not as though these moves have been significant.

With small caps and large caps at two different ends of the performance spectrum this week, we wanted to highlight each index’s price chart to show how the moves look from a longer-term perspective. IWM has seen a pretty swift reversal in the last week, but it also follows a short-term move that was much steeper to the upside. Large caps like SPY, on the other hand, saw more gradual (relatively) increases leading up to their recent highs and remain right near all-time highs with the S&P 500 actually coming up just short of a record closing high on Tuesday.

Start a two-week trial to Bespoke Premium to read today’s full Morning Lineup.