Bespoke Baskets Update – December 2021
B.I.G. Tips – Retail Sales Whiff
Pockets of Strength in Emerging Markets
So far this year, the US has outperformed every other country on the planet. Broadly speaking, developed economies have outperformed emerging economies. The iShares MSCI Emerging Markets ETF (EEM) has declined 6.8% in 2021, but this does not necessarily mean that performance across every emerging economy has been negative. Although China, Brazil, and South Korea have been particularly weak (three of the top six countries of exposure for EEM), countries like Taiwan, India, Russia, Mexico, and South Africa have experienced positive returns this year.

Just like individual sectors in the US cannot be expected to perform equally, emerging economies don’t always perform in unison with each other. Differences include natural resources, political & legal structure, trading partners, and much more. Although EEM has declined on a YTD basis, the average performance of the nine countries that we tracked was a modest loss of 0.1%, and the spread between the best performer (Taiwan) and the worst (Brazil) is currently 41.3 percentage points. Moving forward, investors may want to consider selecting individual countries to gain emerging market exposure, as the broader ETFs tend to have a large concentration in just a few countries. Emerging markets are inherently higher-risk investments in comparison to developed nations due to uncertainty in future prospects, but in the long run, there are excellent opportunities within pockets of emerging markets, although not all countries will see the same performance. Click here to view Bespoke’s premium membership options.
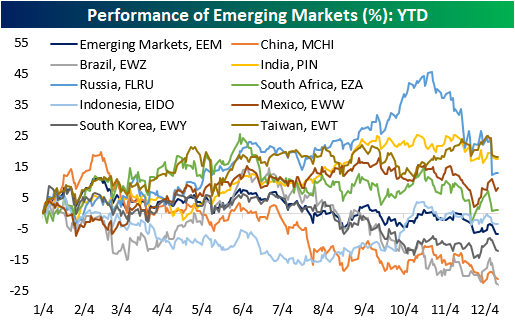
Chart of the Day: Fed Days
Bespoke’s Morning Lineup – 12/15/21 – Big Data Day
See what’s driving market performance around the world in today’s Morning Lineup. Bespoke’s Morning Lineup is the best way to start your trading day. Read it now by starting a two-week trial to Bespoke Premium. CLICK HERE to learn more and start your trial.
If you insist on certainty, you will paralyze yourself.“ – J. Paul Getty
Ahead of today’s FOMC meeting, we just got some important economic data in the form of Empire Manufacturing, Retail Sales, and Import Prices. Overall, the results weren’t very good. While Empire Manufacturing came in better than expected, retail sales were much weaker than expected at both the headline level and ex-autos and gas. Headline retail sales came in at just 0.3% versus expectations for a gain of 0.8%. When you factor in inflation, though, sales were negative. Lastly, import prices rose more than expected coming in at 0.7% versus forecasts for an increase of 0.6%. On a y/y basis, import prices were up 11.7%.
Futures were flat heading into the report, and have actually picked up a little steam with Nasdaq leading the way. In addition to these reports, Business Inventories and homebuilder sentiment from the NAHB will be released at 10 AM.
Read today’s Morning Lineup for a recap of all the major market news and events from around the world, including the latest US and international COVID trends.
While the stock is already down 4% from its intraday high on Monday, shares of Apple (AAPL) still remain about 25% above their 200-day moving average (DMA). That’s off the recent high of 28% back on Friday, but it’s still elevated relative to history. Going back to 2011, there are only two periods where the stock’s spread relative to its 200-DMA reached significantly higher levels than 25% while there are another three (2014, 2017, and 2018) where the spread reached similar levels before pulling back.

Start a two-week trial to Bespoke Premium to read today’s full Morning Lineup.
Daily Sector Snapshot — 12/14/21
Meet the New Boss, Even Stronger Than the Old Boss
Back in the late 1990s, almost everyone had a similar story. They either had ‘this friend’ or knew someone who without a lot of financial background took a flier on a stock called Intel (INTC), held it for years, and became a millionaire in the process. Granted, these stories don’t seem as impressive nowadays with some people turning thousands into millions in a much shorter period of time, but at the time, the run in INTC was something dreams were made of. Looking just at the stock’s performance beginning in 1991 and through its peak in August 2000, INTC rallied nearly 6,300%. That’s a ten-bagger times six!

Despite semiconductors only becoming a bigger part of the economy in the most recent bull cycle, INTC has been a laggard relative to other semis over the last ten years. Hands down, the star of this cycle has been Nvidia (NVDA), and if we compare the performance of INTC from 1991 through the end of 2000 to NVDA now, there are a number of similarities. The first chart compares INTC’s performance in the 1990s through its August 2000 high to NVDA’s performance starting in 2012 and covering the same amount of time. As shown, both stocks followed very similar paths. Whereas INTC was up 6,300%, NVDA was up over 6,700%.
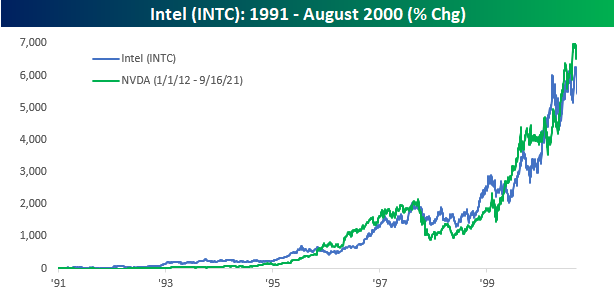
The last four months of 2000 were rough on INTC, though. From September through December 2000, INTC shares fell nearly 60%, cutting the nearly 6,300% advance down to 2,780%. Unlike INTC, though, NVDA has kept running. At its most recent high on 11/19, NVDA’s rally since the start of 2012 was 10,000% – or a hundred bagger! Since that peak, NVDA shares have pulled back just over 15%, taking its total gain down to ‘just’ 8,610%.
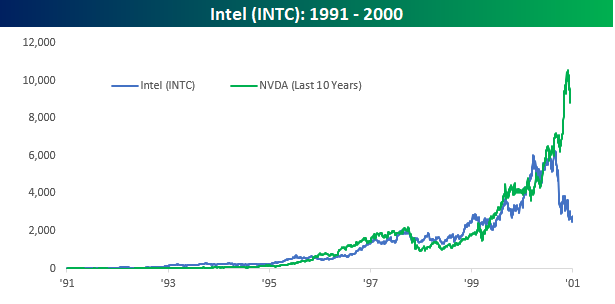
Not only were the last four months of 2000 painful for INTC, but the declines didn’t end there. 2001 and 2002 were also painful years for the stock, and by the time it bottomed in January 2003, INTC was down 79% from its August 2000 peak. Even after that low, INTC didn’t make much headway and actually made a lower low during the depths of the financial crisis, and it wasn’t until 2018 that INTC finally took out its highs from 2000. Just because INTC crashed and burned from its peak during the dot-com bubble after its epic run hardly means that this era’s star from the semiconductor sector will follow a similar path, and it’s not a bet we would make. However, the odds of any stock rallying more than 10,000% in the span of ten years are low enough, but the odds of one trading at over 60 times earnings that is already up 10,000% in ten years continuing that pace in the years ahead are even slimmer. Click here to view Bespoke’s premium membership options.

Inflation Concerns Surging
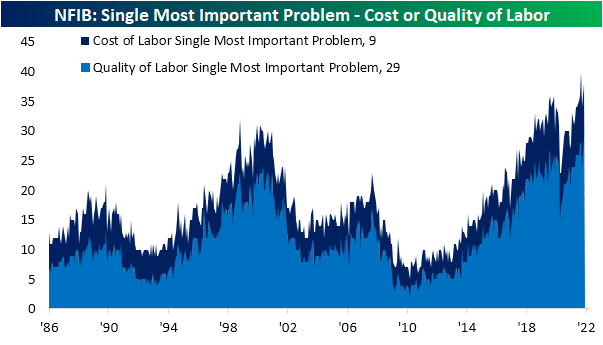
Small business sentiment picked up slightly in November with the NFIB’s monthly reading rising 0.2 points as expected. As for what businesses reported to be their biggest problems, as we noted in today’s Morning Lineup, labor concerns remain top of mind. A combined 38% of respondents reported either cost or quality of labor as their biggest issue. The former of which actually improved in November while the latter surged 5 percentage points. That was one of the largest one-month upticks to date and leaves it at a record high. Meanwhile, there have been been a couple of other indices hitting record lows: competition from big businesses and financial conditions and interest rates. Poor sales also came in the bottom 1% of readings.
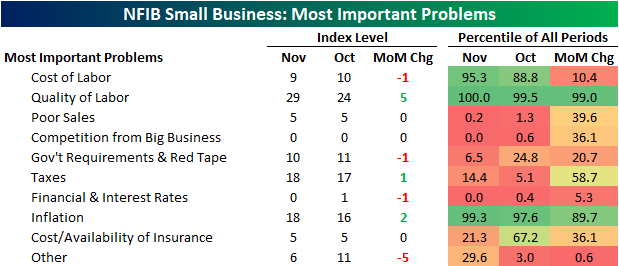
While the largest share of companies see cost or quality of labor as a concern and the combined reading was higher versus October, that was still below the peak of 40% set in September.
Panning across the other problems, other than labor, inflation is the other key issue for small businesses. The percentage of respondents reporting inflation as their biggest issue has surged in recent months gaining another two percentage points to 18% in November. As shown below, the only other time in which as high of a share of respondents saw inflation as the biggest issue was in 2008. While there is not enough information to distinguish what the exact problems are, “other” also plummeted in November after a brief spike higher in October.
Pivoting back to inflation, the massive jump in November means it tied taxes as the second most important problem for small businesses. In the chart below, we show the rankings of those two series as well as the quality of labor (which is currently the most important problem) over the history of the survey. The surge in inflation’s importance is unprecedented in this data save for 2008 when it was briefly the most important problem. Click here to view Bespoke’s premium membership options.
![]()
Meme Stock Breakdown
There have been plenty of market happenings and themes in 2021 but perhaps one of the more intriguing ones was the recurring bouts of meme stock mania. The first of these was the massive short squeeze in shares of GameStop (GME) in the first month of the year which pulled other highly shorted names higher along with it. One of those other stocks was AMC Entertainment (AMC) which would later become the poster child for another string of outperformance of heavily shorted names. In the time since then, these stocks have generally trended sideways maintaining huge gains on the year, but they are also well off their highs. And in the past few days, these stocks have fallen below support and below the past several months’ ranges.


Checking up on highly shorted stocks, last Thursday the latest short interest data through the end of November was released. As shown below, of the Russell 3,000 stocks, Prelude Therapeutics (PRLD) currently has the highest level of short interest with 85.67% of shares sold short. Couchbase (BASE) is the only other stock with over half of shares shorted. BASE is a very new stock, though, debuting in July, after the GME and AMC short squeezes. The same can be said for stocks like Xometry (XMTR), Torrid (CURV), and Verve Therapeutics (VERV). For the most part, the stocks that are currently the most heavily shorted are down dramatically on the year and since the short squeeze peaks/meme stock manias of earlier this year (1/26 for GME and 6/2 for AMC). The only one of the top 20 most heavily shorted stocks that is up year to date is Gogo (GOGO) with a 33.44% gain.

Notably, those aforementioned meme stocks no longer find themselves high up on the list of the most heavily shorted stocks. In fact, of all Russell 3,000 members with 10% of float sold short, GME ranks as the 396th most heavily shorted today whereas it was by far the most shorted at the start of the year when 144.34% of shares were sold short. Given that decline, it is the stock that has seen the largest drop in short interest year to date. Dillard’s (DDS), BigCommerce (BIGC), and Ligand Pharma (LGND) have also seen drops of more than 50 percentage points in short interest as a % of float. While there have been some huge declines in short interest, not all are necessarily a result of a short squeeze. For example, Acutus Medical (AFIB) and American Well (AMWL) have both seen a consistent grind lower this year that have left them with single-digit prices and year-to-date declines of 89% and 75%, respectively.

Turning to the opposite end of the spectrum, in the table below we show the stocks that have seen short interest rise the most since the start of the year. PRLD is at the top of the list with a 67.46 percentage point increase. The next highest is Skillz (SKLZ) which has risen 37.82 percentage points. For the most part, these stocks that have seen short interest climb the most are down big on the year. There are a handful of exceptions though with Citi Trends (CTRN), AerSale (ASLE), Fisker (FSR), Big 5 Sporting Goods (BGFV), and Independence Realty Trust (IRT) having seen double digit percentage point jumps in short interest following big gains upwards of nearly 90% this year. Click here to view Bespoke’s premium membership options.
