Bespoke Stock Scores — 11/23/21
Bespoke’s Morning Lineup – 11/23/21 – Tapping the Spigot
See what’s driving market performance around the world in today’s Morning Lineup. Bespoke’s Morning Lineup is the best way to start your trading day. Read it now by starting a two-week trial to Bespoke Premium. CLICK HERE to learn more and start your trial.
“The individual investor should act consistently as an investor and not as a speculator.” – Benjamin Graham
We’re seeing a mixed tone in equity futures this morning after a pretty significant negative reversal in equities yesterday. Continuing the trend from yesterday, Dow futures are indicated slightly higher, S&P 500 futures are flat, and the Nasdaq is lower, but all three indices are off their overnight lows. While earnings season unofficially ended last week, it’s been a busy morning for earnings as companies squeeze in results today ahead of the Thanksgiving holiday. In terms of investor reactions to the report, it has been mostly negative with stocks like Abercrombie (ANF), Best Buy (BBY), Urban Outfitters (URBN), and Zoom (ZM) all down between 5% and 10%.
Where the real action has been the last two days is in the Treasury market, especially the two-year where the yield is on pace for a two-day increase of 14 basis points (bps). If these levels hold through the end of the day, it would mark the biggest two-day increase in the two-year yield since March 2020.
In economic news, European flash PMI readings for the month of November were released and came in better than expected at the headline level despite the rising COVID case numbers. Internals of the reports, however, were not quite as strong. The US calendar today also includes flash PMI readings for November as well as the Richmond Fed. Next week will be an extremely packed calendar as it will be the last day of economic releases for the week.
Lastly, in what was a widely expected move this morning, the US announced that it would release some oil from the Strategic Petroleum Reserve in coordination with other countries including China, India, Japan, Korea, and the UK. Given the move was widely expected, the market reaction has been muted.
Read today’s Morning Lineup for a recap of all the major market news and events from around the world, including the latest US and international COVID trends.

As shown in the charts below, while value stocks were correcting last week (charts on left), the rally in growth stocks went on unabated, and yesterday’s reversal appears to have been a bit of catch-up trade.

Start a two-week trial to Bespoke Premium to read today’s full Morning Lineup.
Daily Sector Snapshot — 11/22/21
Reopening Trade and Value Rebound
Last Friday when lockdown and COVID news were front and center, we showed how performance was largely reminiscent of the performance during the COVID Crash lasting from 2/19/20 to 3/23/20. Today, that relationship is largely being flipped back on its head with the three deciles of the worst-performing stocks during the COVID Crash now the top performers in today’s session. All other deciles are also higher to start the week, but to a much more modest degree.

Looking at some other themes of today’s price action, those stocks that were up the least on a year-to-date basis through the end of last week are underperforming with an average gain of only 13 bps. All other deciles are up around half of one percent or more.
While that relationship is somewhat messy, there is also a clear theme today of value outperformance. As shown in the second chart below, the S&P 500 members with the lowest P/S ratios are outperforming today. The first decile of stocks with the lowest price to sales multiples are up 1.82% on average. That compares to the other end of the spectrum where the stocks trading at the highest premium to sales are down 1.14% on average.

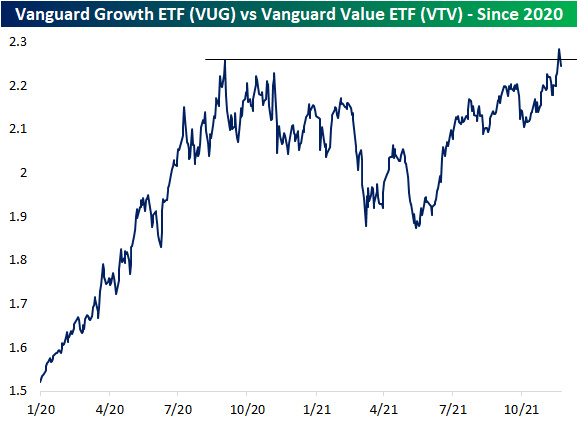
Taking a longer-term look at the relationship of value and growth, in the chart below we show the ratio of the Vanguard Growth ETF (VUG) versus the Vanguard Value ETF (VTV). As shown, the line has been trending higher since the late spring and it even broke out to a new high at the end of last week. The underperformance of growth stocks today is leading that line to fall back below those prior highs. Click here to view Bespoke’s premium membership options.
No Case of the Mondays to Be Found
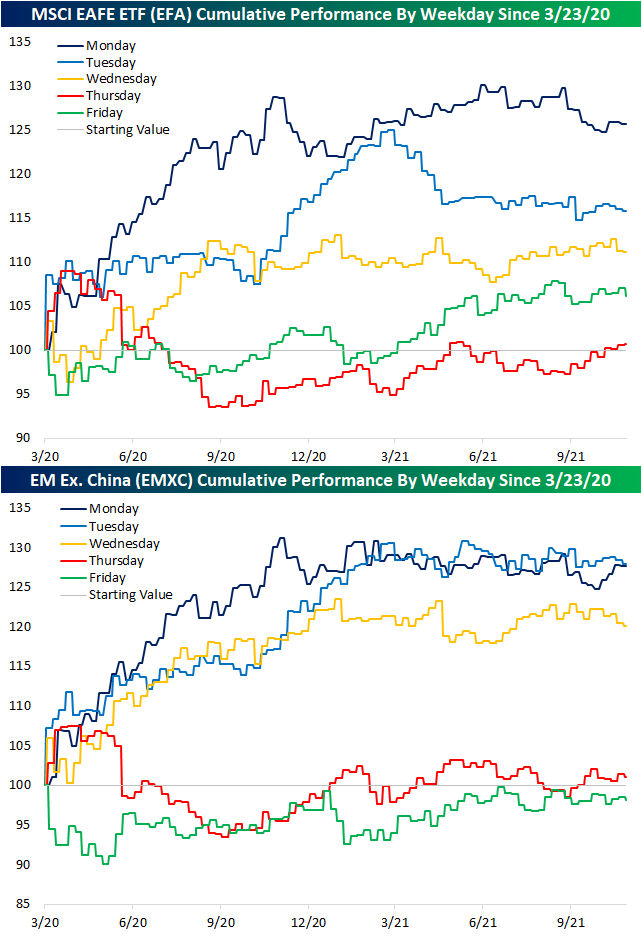
The S&P 500 is hitting a record high to start out the holiday-shortened week. As we noted last week, the past couple of decades have seen particularly strong performance on the Monday of Thanksgiving week, but Mondays have also been consistently strong for the current bull run. In the table below, we show the average daily change in basis points (bps) of various assets (proxied by ETFs) by day of the week since the COVID crash low on 3/23/20.
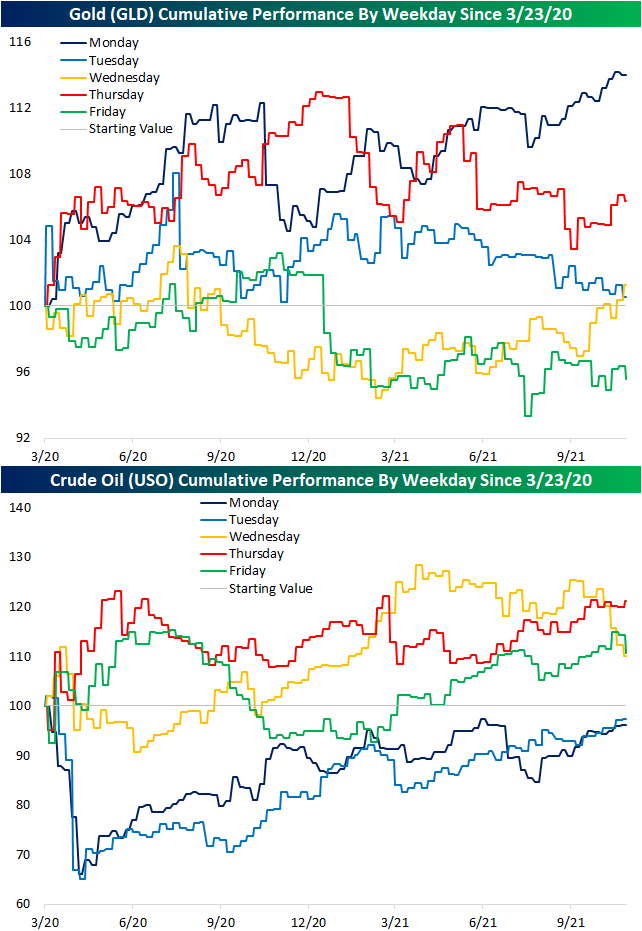
The market hasn’t seemed to have a case of the Mondays yet during this bull market with Mondays consistently ranking as the strongest day of the week for the S&P 500 (SPY), S&P 500 Value (IVE) and Growth (IVW), the NASDAQ 100 (QQQ), Russell 2,000 (IWM), and MSCI EAFE ETF (EFA). In the commodities space, Mondays have also been the strongest day of the week for Gold (GLD). While Mondays haven’t been the strongest day for the Emerging Markets excluding China ETF (EMXC)—we chose EMXC rather than the MSCI Emerging Market ETF (EEM) due to EEM’s outsized weighting of China/Hong Kong—it has tended to start the week strong with an average gain of 27 bps gain on Monday followed by a 29 bps average gain on Tuesdays. Crude Oil (USO), Long Term Treasuries (TLT), and the US Dollar (UUP), on the other hand, have all experienced weak Mondays followed by stronger returns on Thursday or Friday. They are also the only two ETFs in the matrix below that have averaged declines on more days of the week than they have averaged gains.

Taking a closer look at these trends over the course of the current bull market, in the charts below we show the cumulative performance of $100 invested in each of these ETFs beginning on 3/23/20 owned only on specific days of the week. For US equities, Monday strength distanced itself from the rest of the week early on in the pandemic era. For S&P 500 Value (IVE), the end of the week has also been distancing itself this year as the other notably strong day of the week. For Growth (IVW) and the NASDAQ (QQQ), Thursdays have been particularly strong of late.

Looking abroad, the MSCI EAFE ETF (EFA) and MSCI Emerging Market ex. China ETF (EMXC) have both seen outperformance on Mondays too. For the latter though, Tuesdays have been running right in line all year and Wednesdays are not that far behind. The second half of the week has been essentially flat.
Turning to commodities, Gold (GLD) has also seen strength on Mondays, but that is about the only silver lining. Holding on Tuesdays and Thursdays would also see some appreciation but that strategy has seen declining over the past several months. Wednesdays only recently moved out of the red while Fridays have barely recovered.
For Crude Oil (USO), holding in the first half of the week has been a losing strategy, although it has been steadily improving. Holding on Wednesdays has seen a sharp turn lower over the past several weeks.
USO is not alone in having a bad first half of the week. For US Long Term Treasuries (TLT), the only day of the week that currently is not in the red is holding on Thursdays. For UUP, the only days of the week that have a cumulative gain since March 2020 are Wednesdays and Fridays, and for those two days, the gains are only minimal. Click here to view Bespoke’s premium membership options.

Bespoke Charts as a Glance – 11/22/2021
You’ve likely seen Bespoke’s premium research before, but we continue to publish unique and timely analysis in reports like our Morning Lineup, BIG Tips, Sector Snapshot, Bespoke Baskets, Closer, and more.
Additionally, every Friday we publish our Bespoke Report newsletter — a detailed PDF that is easily digestible but super informative. You can see Bespoke’s current thoughts on global markets and the economy in this report.
If you’re not yet a Bespoke subscriber, you can gain access by simply starting a two-week trial to any of the three Bespoke membership levels listed below. You can revisit our membership options here.
Join Bespoke Newsletter (Weekly Bespoke Report + COTD; Lowest price)
Join Bespoke Premium (Newsletter research + Morning Lineup, BIG Tips, and more)
Join Bespoke Institutional (Access to everything!)
Below is a look at a handful of charts published in our most recent Bespoke Report that we thought were interesting or noteworthy. Receive charts and analysis like this in your inbox daily by signing up for a two-week trial to Bespoke Premium.
Last week, market performance was mixed, as the S&P 500 and Nasdaq finished the week higher while the Dow and Russell 2000 declined over the week. On Thursday, the S&P 500 finished the trading day at a record high for the 66th time this year, which is a pace that is now the second highest in the post-World War II era. We have now passed 1964 in terms of the number of closing all time highs, and are second only to 1995, in which 77 record highs were recorded at the close. At our current pace, this year would finish with 75, so the fight for first place will likely come down to the wire.

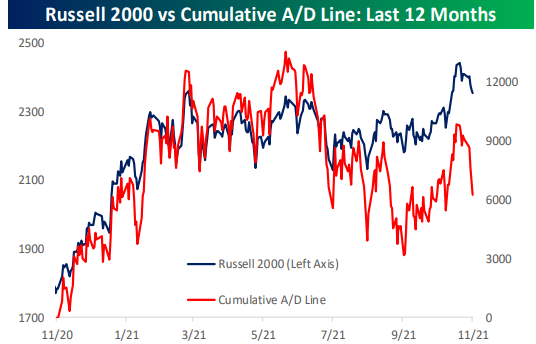
Over the last year, the breadth of the market has been strong as well, at least in the large-cap space. The cumulative advance/decline line, which we use to measure underlying market breadth, did turn negative after the market set new highs at the close on Thursday, but broadly speaking breadth has been strong. In the Russell 2000, the spread between the index’s performance and its cumulative advance/decline line is much larger. After tracking closely in the first half of the year, the spread has increased in the second half of the year. Last week, every trading day saw more decliners than advancers for the members of the Russell 2000, resulting in the worst weekly breadth reading since early September.
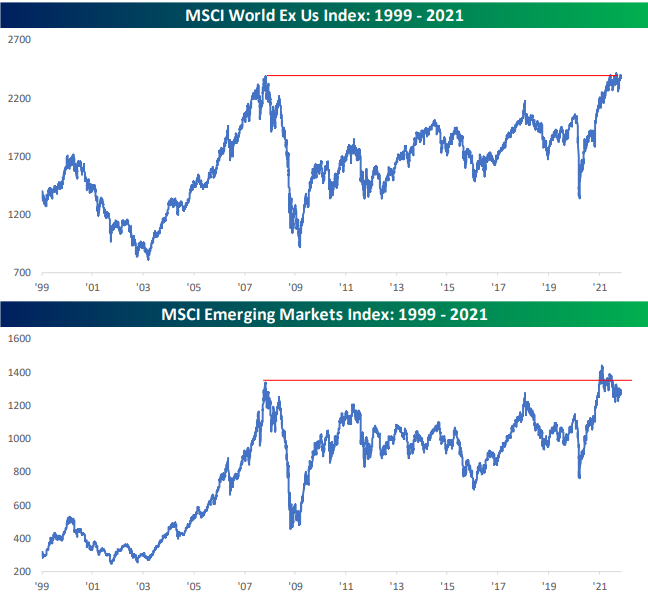
Although US equity market performance has been strong over the last decade, the rest of the world has generally lagged. This is not a new trend, and indices tracking both the world ex US and emerging markets did not reach new highs since 2007 until this year. Both of these indices are now back below their 2007 peak, which is quite intriguing. Should the indices break out above these levels, interest in international stocks may increase meaningfully.
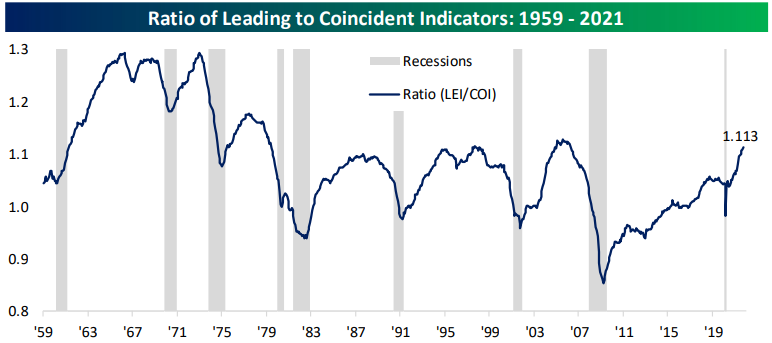
Encouragingly, the ratio of leading indicators to coincidence indicators has continued to rise, which makes the event of a recession unlikely at the moment. As shown below, since 1960, this ratio has peaked before a recession, which is yet to occur since the COVID correction. Even though housing data has been showing signs of slowing, the broader economy remains on a firm footing.
Stocks of homebuilders tend to track the movements in housing starts, but in recent months, we have seen a relatively large divergence between the two. While housing starts have weakened, homebuilder stocks have moved to new highs. Investors seem to believe that the pullback in housing starts will be temporary.

From the COVID low in April 2020, retail sales have risen over 55%, making new highs only five months after the COVID crash began. Since the all-time high reading seen in early 2020, retail sales are up over 21%. After this reading crashed in 2008, it took 40 months to make new highs. The charts shown in this post are only a handful of the dozens included in our weekly Bespoke Report that include much more detailed analysis for subscribers to review. You can receive reports like this in your inbox daily by signing up for a two-week trial to Bespoke Premium. Give it a try now!

Chart of the Day – Semiconductors Up 1%+ Six Weeks in a Row
Bespoke’s Morning Lineup – 11/22/21 – Positive Start to a Short Week
See what’s driving market performance around the world in today’s Morning Lineup. Bespoke’s Morning Lineup is the best way to start your trading day. Read it now by starting a two-week trial to Bespoke Premium. CLICK HERE to learn more and start your trial.
“No man ever steps in the same river twice, for it’s not the same river and he’s not the same man.” ― Heraclitus
It’s a holiday-shortened week, but there is some excitement this morning as reports suggest that Biden has made his decision on who will be the Fed chair in the next term. US futures are higher this morning on little news, but over in Europe, COVID trends continue to move in the wrong direction. German Chancellor Merkel described the current situation as dire, as the country’s health minister said Germans will be ‘vaccinated, cured, or dead’ by Spring. Case counts in the country continue to surge with new cases coming in at a similar rate to the UK while other countries in the region continue to see their case counts spike higher as well.
Read today’s Morning Lineup for a recap of all the major market news and events from around the world, including the latest US and international COVID trends.
US equity futures are off to a positive start to the week, but the same can’t be said for the crypto space where prices are down 3% or more across the board. Bitcoin is currently trading down closer to 4%, and this morning’s decline follows a weekend rally that stalled out just below the 50-day moving average (DMA). As shown in the chart below (and the enlarged portion of the last week), after dropping below its 50-DMA for the first time since October 1st last week, bitcoin rallied on Saturday and into Sunday. That momentum wasn’t able to carry into the new trading week, though, and at current levels, the world’s largest crypto is on pace for its lowest closing price since mid-October.

Start a two-week trial to Bespoke Premium to read today’s full Morning Lineup.
Bespoke Brunch Reads: 11/21/21
Welcome to Bespoke Brunch Reads — a linkfest of the favorite things we read over the past week. The links are mostly market related, but there are some other interesting subjects covered as well. We hope you enjoy the food for thought as a supplement to the research we provide you during the week.
While you’re here, join Bespoke Premium with a 30-day free trial!
Finance
The hidden ‘replication crisis’ of finance by Robin Wigglesworth (FT)
One of the cornerstones of science (even social science, like academic finance) is replication or the idea that results can be repeated by future researchers; if something can’t be replicated, it’s probably not accurate. Finance has a major issue with these sorts of efforts. [Link; paywall]
Michael Mauboussin Is Unshaken by Eric Uhlfelder (RIAIntel)
An interview capturing the investment approach and experience of Michael Mauboussin, the legendary Columbia University professor and widely recognized strategist. [Link]
Retirement Fund Giant Calpers Votes to Use Leverage, More Alternative Assets by Heather Gillers (WSJ)
California’s pension giant (managing almost half a trillion dollars) sees below-typical historical returns that won’t be high enough to pay out on its obligations. The response from CalPERS is to add leverage to bring return targets back to their goal. [Link; paywall]
SARK launches as short interest in ARKK jumps to new record by Steve Johnson and Emma Boyde (FT)
In a first, an ETF has launched with the explicit goal of trading in the opposite direction of another ETF, specifically the ARKK vehicle which is the cornerstone of Cathie Wood’s ARK Invest empire. [Link; paywall]
Crypto
Tokenize Everything by Dave Nadig (ETF Trends)
Background on the rapidly expanding world of ERC-20 tokens, which are starting to look a lot like single stocks complete with vehicles for gaining index exposure to tokens (analogous to ETFs). [Link]
ConstitutionDAO — a $20 million stupid Ethereum trick by David Gerard and Andrew Molitor (David Gerard)
Decentralized Autonomous Organizations (DAOs) are an interesting approach to crowdfunding, charity work, or business structuring, but the highest-profile DAO so far descended into farce amidst a blaze of hype when it tried to buy a copy of the US Constitution. [Link]
Sustainability
Norway Is Running Out of Gas-Guzzling Cars to Tax by Morgan Meaker (Wired)
The vast majority of new cars sold in Norway are electric, which has created a >$2bn revenue problem for the country’s national government as the tax base of ICE vehicles craters. [Link; soft paywall]
Elon Musk Wants to Show Germans How to Build Cars by William Wilkes and Stefan Nicola (Bloomberg)
The German factory that will flood Europe with Teslas is taking a very different approach to traditional auto manufacturers, which could rapidly ramp up production with lower labor cost than traditional manufacturers are able to manage. [Link; soft paywall]
The Potentially Game-Changing Celera 500L Has Finished Its First Round Of Flight Tests by Joseph Trevithick (The Drive)
A new general aviation plane prototype is claiming to deliver operating costs 84% below what comparable private jets can manage, with fuel economy many times as high and more than twice the maximum range. [Link]
Streaming
How Much Does Mariah Carey Make When ‘All I Want for Christmas Is You’ Is Streamed? by Jermell Prigeon (NBC Philadelphia)
The fantastic popularity of Mariah Carey’s holiday anthem rises every year in a perfect seasonal pattern. Even at a penny per stream, the results are spectacular: almost $2mm per year in royalties accrue to the Christmas Queen. [Link]
Inflation
No, the real inflation rate isn’t 15 percent by Timothy B Lee (Full Stack Economics)
The CEO of Twitter has proudly amplified a statistical series that claims to adjust for changes in BLS methodology, but is itself founded on a complete misunderstanding which leads to a laughably incorrect representation of prices. [Link]
Hoops
Stephen Curry’s Scientific Quest for the Perfect Shot by Ben Cohen (WSJ)
Data science and optical sensors power Steph Curry’s offseason workouts, where anything more than three inches from dead center is considered a miss. [Link; paywall]
Modern Work
Ping. Ding. Chirp. Notifications Are Driving Us Crazy. by Rachel Feintzeig (WSJ)
Research suggests constant notifications are a huge factor in reducing productivity, regardless of the source. And between emails, Slack, and the cacophony of other alerts we receive, you can forget on deep and prolonged focus. [Link; paywall]
Read Bespoke’s most actionable market research by joining Bespoke Premium today! Get started here.
Have a great weekend!