Bespoke’s Matrix of Economic Indicators – 11/29/21
Our Matrix of Economic Indicators provides a concise summary analysis of the US economy’s momentum. We combine trends across the dozens and dozens of economic indicators in various categories like manufacturing, employment, housing, the consumer, and inflation to provide a directional overview of the economy.
To access our newest Matrix of Economic Indicators, start a two-week free trial to either Bespoke Premium or Bespoke Institutional now!
Texas Tea Double Digit Dip
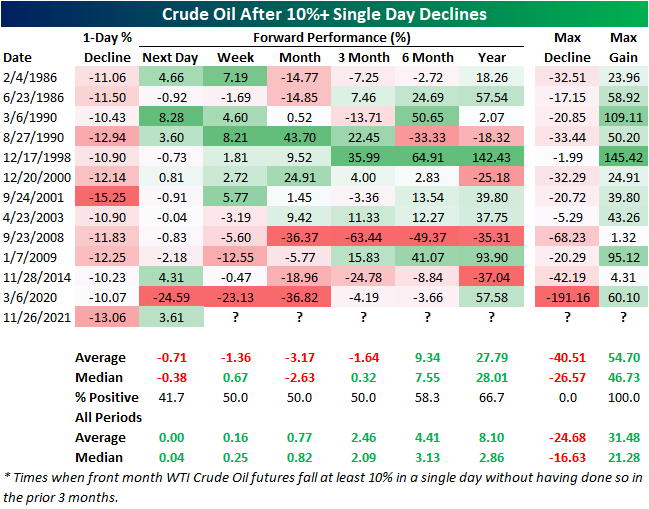
Crude oil prices are back on the rise this week after a sharp decline last Friday. As for how severe of a drop it was, front-month WTI futures fell 13.06% which was the worst single-day decline since April of last year; the same month that saw crude prices dive into negative territory. Looking back to 1983, including last Friday, there have only been 32 days in which crude has fallen double-digit percentage points in a single session. Outside of the series of volatile moves in March and April 2020, November 28, 2014 was the last time that there was as sharp of a decline of at least 10 percentage points.

Crude prices are rebounding today and are currently back above $70, although they’ve been pulling back all morning. In the table below, we show the other dozen times prior to Friday in which crude oil fell at least 10% in one day without having done so in the prior 3 months. As shown, today’s rebound is actually pretty abnormal with WTI typically declining the day after a 10% drop.
As for longer-term forward performance, crude has continued to average declines out over the next three months with positive returns only half the time. On the other hand, six months to one year out has tended to see stronger than normal returns for the commodity. Click here to view Bespoke’s premium membership options.
Bespoke’s Morning Lineup – 11/29/21 – Back to Work
See what’s driving market performance around the world in today’s Morning Lineup. Bespoke’s Morning Lineup is the best way to start your trading day. Read it now by starting a two-week trial to Bespoke Premium. CLICK HERE to learn more and start your trial.
“The ability to concentrate and to use time well is everything.” – Lee Iacocca
Markets are looking to recover a chunk of Friday’s losses in early trading this morning. Equity futures are up across the board, but the Nasdaq is leading the way higher erasing about 40% of Friday’s losses. Crude oil is also bouncing back above $70 with a gain of over 5%, copper is up 1.5%, and the yield on the 10-year US Treasury is up 6 basis points (bps) to 1.54%. In crypto, bitcoin is trading just below $57K gaining nearly 4% while Ethereum is trading just above $4,300.
Investors are trying to make sense of the latest Omicron Covid strain, but at this point more seems to be unknown than known. Clouding things even more, we’re unlikely to have definitive answers in the immediate future. Early reports have suggested that symptoms from this latest strain have been mild and that vaccines are still likely to provide good protection from severe illness, but that it is also more transmissible. While demographics may be a factor behind the mild symptoms (younger population in South Africa), if that did turn out to be the case overall, it would certainly be a positive. Even if the best-case scenario does play out and Friday’s panic proves to be a massive over-reaction by markets and governments around the world, the short-term impact of restrictions on activity and international travel around the world will have some economic impact. Just last night, Japan announced that it will ban the entry of foreign travelers joining Israel, which made the same announcement last week.
Read today’s Morning Lineup for a recap of all the major market news and events from around the world, including the latest US and international COVID trends.
Whether you’re looking at small caps or large-cap equities, it’s a tale of two markets this week. In the small-cap space, the Russell 2000’s break out earlier this month looks increasingly like a fakeout, and rather than a new leg higher, the question for small-caps is whether they can hold support at the uptrend line from the summer lows and not break down. For large caps, the S&P 500 still remains well above its breakout level from the summer high before September’s sell-off. Support for the S&P 500 doesn’t come into play until the 50-day moving average which is just above the 4,500 on the index and $450 for SPY.

Start a two-week trial to Bespoke Premium to read today’s full Morning Lineup.
Chart of the Day: VIX Surges Near All-Time Highs
Daily Sector Snapshot — 11/26/21
Shortened Day Bloodbath
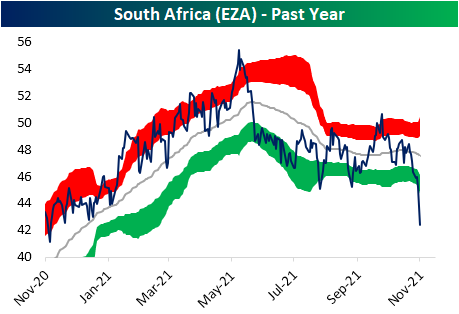
It may have been a shortened session in the US, but equities took a big hit around the globe today. In the matrix below, we show the ETFs of the 23 countries in our Global Macro Dashboard. As shown, there was only one ETF that was down less than one percent today: Switzerland (EWL). After that decline, it is now one of only two other countries that are currently above their 50-DMAs: the S&P 500 (SPY) in the US and Taiwan (EWT). With that said, both of those countries have pulled back dramatically. Alongside Brazil (EWZ), those two countries are also the only ETFs of this screen that are still in the green for the month of November. As could be expected, the title of the worst performer with a 6% decline today belongs to ground zero of this new strain of COVID: South Africa (EZA). As a result, it is now at ‘off the chart’ oversold levels trading 3.62 standard deviations below its 50-DMA. Although they are not as oversold as South Africa, Spain (EWP) and India (INDA) are also more than 3 standard deviations below their 50-DMAs. Meanwhile, Mexico (EWW) is the most oversold country ETF trading almost 4 standard deviations below its 50-DMA.

The drop in South Africa equities has been dramatic, but that is also in the context of what has already been a downtrend over the past few months. Tacking on today’s declines, EZA is now almost flat over the past year.
Steep declines have also resulted in technical breakdowns of multiple other countries like Germany (EGW) and Japan (EWJ). Other European countries like France (EWQ), Italy (EWI), and the UK (EWU) may not have broken below support, but they are at the low end of their recent ranges. As for Canada (EWC) and the United States (SPY), the pullbacks are notable but not as much of a negative following strong gains this fall. Click here to view Bespoke’s premium membership options.
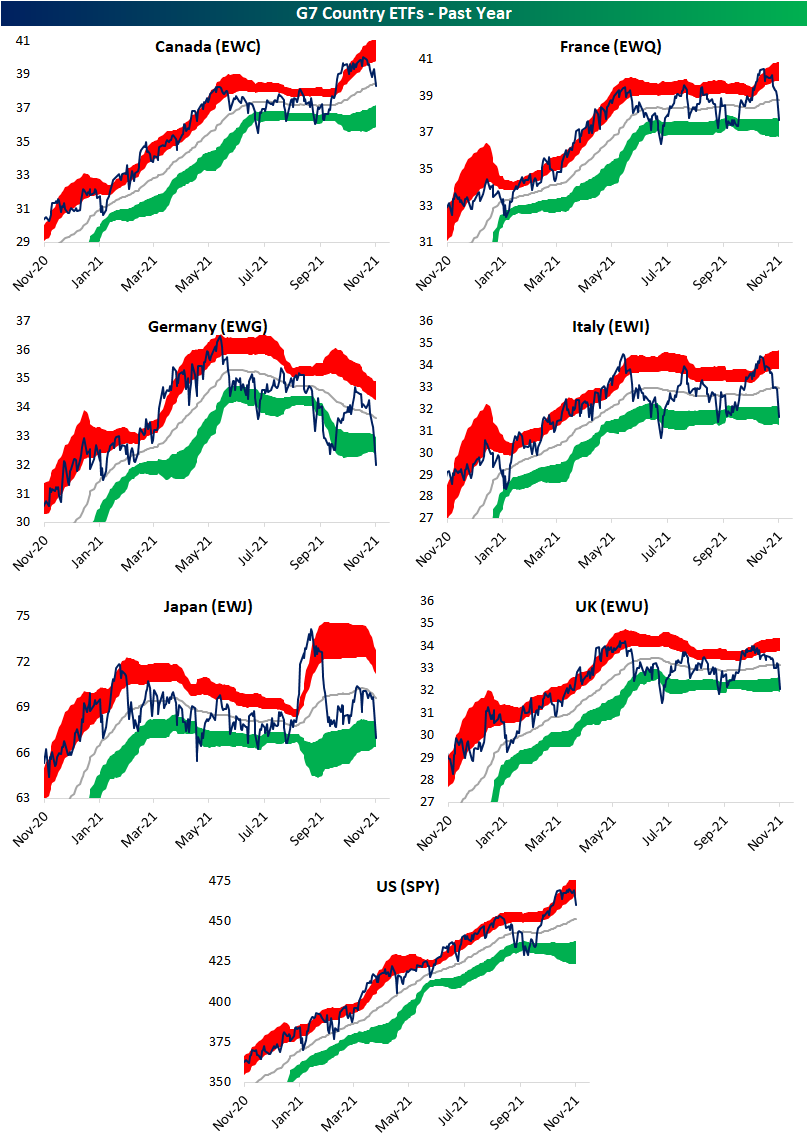
Chart of the Day – SPY Gaps Down on COVID Headlines
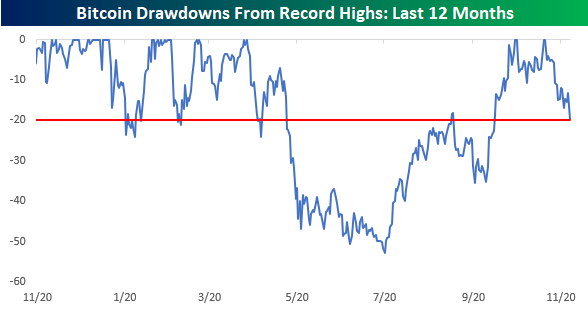
Bitcoin Drawdown Nears 20%
Like just about all other risk assets this week, it’s been a rough one for bitcoin. As of Friday morning, the world’s largest cryptocurrency was trading down over 7% to the low $54K range. After taking out its spring highs in late October and then making a higher high in November, bitcoin has seen a sharp and swift pullback in the last few weeks falling nearly 20%. Even after the current pullback, the uptrend from the summer lows for bitcoin remains intact as a break of that trendline wouldn’t come into play until around the $50K level.
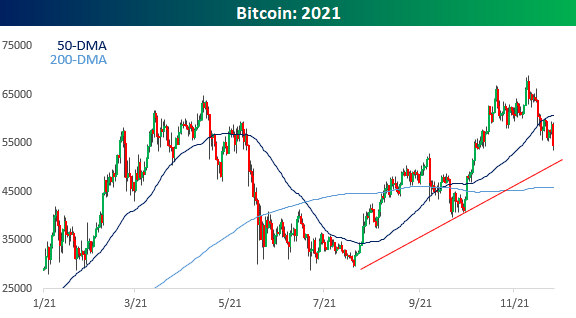
As anyone even paying some attention already knows, volatility is no stranger to bitcoin. While the current pullback is nearing the 20% threshold, in the last year alone, bitcoin has seen a number of pullbacks from record highs of similar or even greater magnitude. As shown in the chart below, if the current pullback reaches the 20% threshold, it would be the fourth pullback of that magnitude or more from a record high in the last twelve months. Of those three prior pullbacks, the first two bottomed out at declines of less than 25%, but the most recent was much deeper as bitcoin was more than cut in half from its April closing high to its July closing low. Click here to view Bespoke’s premium membership options.
Bespoke’s Morning Lineup – 11/26/21 – So Much for a Sleepy Friday
See what’s driving market performance around the world in today’s Morning Lineup. Bespoke’s Morning Lineup is the best way to start your trading day. Read it now by starting a two-week trial to Bespoke Premium. CLICK HERE to learn more and start your trial.
“Anytime anybody tells me the trend is such and such, I go the opposite direction. I hate the idea of trends.” – Clint Eastwood
Prices are being slashed across the investment spectrum this black Friday morning as concerns over the new COVID variant detected in South Africa has investors reigning in risk. It’s important to stress that very little is known at this point about this latest strain, including whether it can evade vaccines or how severe it is relative to other mutations. Therefore, it’s hard to make any informed investment decisions at this point. Historically speaking, chasing a rally or selling into a sharp decline (especially on a very illiquid trading day) rarely ends up being profitable, but that isn’t stopping a lot of people this morning.
Read today’s Morning Lineup for a recap of all the major market news and events from around the world, including the latest US and international COVID trends.
While inflation concerns have shown no signs of abating in November, crude oil prices have been weak and broken some key support levels. Today’s decline of over 5% puts WTI on pace for its worst day since July, and in the process, it has traded below its summer high, which was a level that acted as support earlier this week. This latest break of support follows the break of the trend line that was broken earlier this month, where the subsequent bounce failed right as WTI traded back towards its trend line.

Start a two-week trial to Bespoke Premium to read today’s full Morning Lineup.