Not Pessimistic But Not Optimistic Either
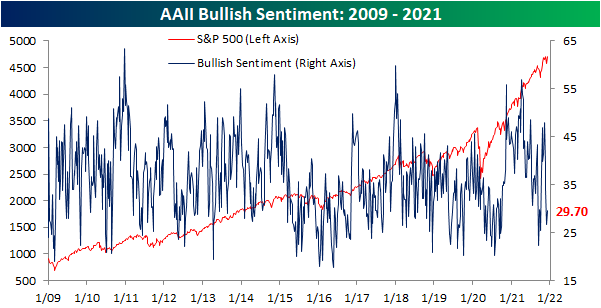
The S&P 500 has made a quick recovery in the past week closing within a few basis points of a new 52-week high yesterday. In spite of that improvement to price, sentiment has yet to fully buy-in. The American Association of Individual Investors weekly sentiment survey only saw a modest improvement to the percentage of respondents reporting as bullish. Just under 30% of respondents reported bullish sentiment versus a level of 26.7% last week. That snapped a streak of back-to-back-to-back declines but still leaves bullish sentiment 4.1 points below where it was only two weeks ago.
While the change in bullish sentiment was nothing to write home about, bearish sentiment plummeted 11.9 percentage points to 30.5%. That was the largest single-week decline since 10/17/19 when bearish sentiment collapsed an even larger 12.91 percentage points. Back then, that brought bearish sentiment to a similar level of 31.05%.
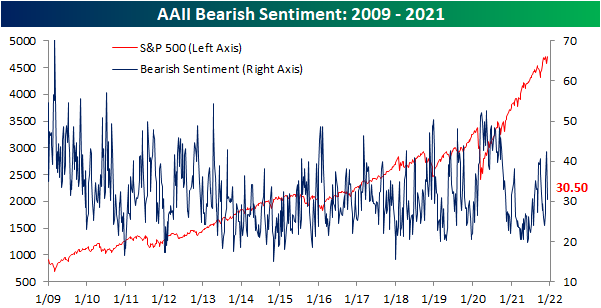
In spite of bearish sentiment’s big reversal lower, the bull-bear spread remains negative, albeit not by much.

Considering bullish sentiment did not meet the big drop in bearish sentiment, neutral sentiment made up the difference rising 8.8 percentage points to 39.8%. That is the highest level of neutral sentiment since the first week of 2020 when it eclipsed 40%.

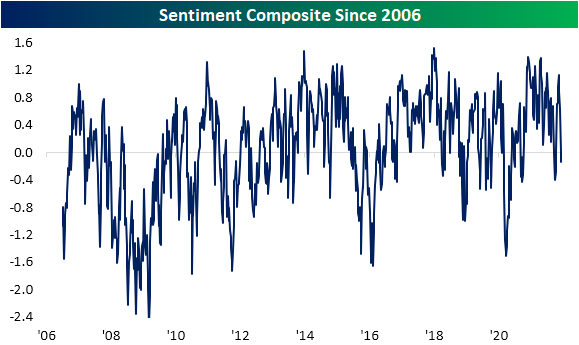
While the AAII numbers showed a big reversal in bearish sentiment, other sentiment indicators took more pessimistic tones this week. The NAAIM Exposure Index collapsed further to the lowest level since mid-October while the Investors Intelligence survey saw the biggest one-week drop in bullish sentiment since October 2019 to the weakest reading since early April 2020. Bearish sentiment, meanwhile, saw the largest one-week uptick since June 2012. As a result of the combined moves across these indicators, our sentiment composite has continued to plummet and is now in negative territory and at the weakest level since late September/early October. Click here to view Bespoke’s premium membership options.
Claims Get Their Seasonal Bump
Seasonally adjusted initial jobless claims saw a substantial 43K decline this week down to not a 52-week but a 52-year low of 184K! While that marked a new low, last week’s print was revised higher by 5K to 227K.
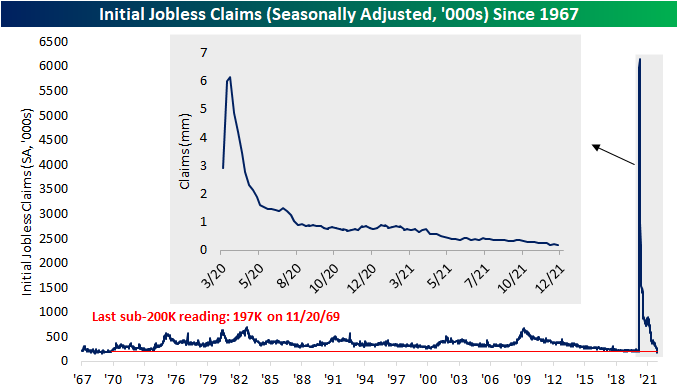
On a non-seasonally adjusted basis, claims were less impressive this week with a 63.7K increase to 280.7K. That jump erased any of the improvements to claims since the end of September.
Although unadjusted claims have now erased the past couple of months of improvements, that is less alarming in the context of seasonality. The current period of the year typically sees claims gradually rise into year-end. Up until this week, that seasonal trend has not exactly been consistent this year, though, as claims have generally trended sideways throughout the fall. Turning back to this week, the current week of the year (49th) has historically seen claims rise week over week 81.5% of the time since 1967 and the average increase to claims is the second largest of any week of the year as well. In other words, if there was a week for claims to play catch up to seasonal norms, it would have been this week. Furthermore, despite this week’s increase in NSA claims of just 64K, it was still below average.


Pivoting over to continuing claims, there was a tick higher to 1.992 million this week from the low of 1.954 million last week. Albeit higher, claims remain healthy below 2 million.

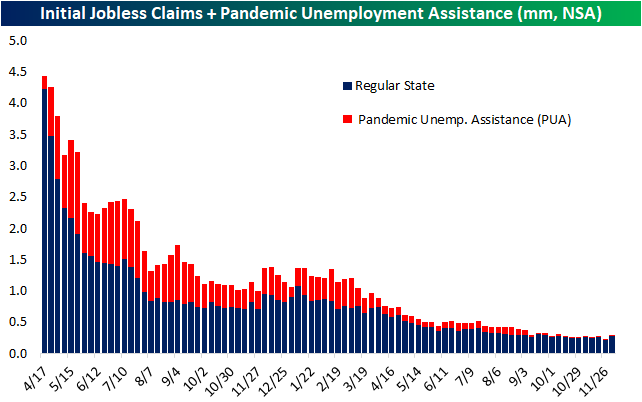
Unadjusted claims can include all other programs which are delayed an extra week making the most reading through the week of November 19th. That week saw total claims fall below 2 million for the first time since the pandemic with broad declines across programs. Regular state claims—which are currently the vast majority of claims since the expiration of pandemic era programs—were the biggest contributor to that decline. Pandemic programs still have a presence but that is dwindling with claim counts for PUA, PEUC, and Extended Benefit claims in the low 100K range. Click here to view Bespoke’s premium membership options.

The Bespoke 50 Growth Stocks – 12/9/21
The “Bespoke 50” is a basket of noteworthy growth stocks in the Russell 3,000. To make the list, a stock must have strong earnings growth prospects along with an attractive price chart based on Bespoke’s analysis. The Bespoke 50 is updated weekly on Thursday unless otherwise noted. There were no changes to the list this week.
The Bespoke 50 is available with a Bespoke Premium subscription or a Bespoke Institutional subscription. You can learn more about our subscription offerings at our Membership Options page, or simply start a two-week trial at our sign-up page.

The Bespoke 50 performance chart shown does not represent actual investment results. The Bespoke 50 is updated weekly on Thursday. Performance is based on equally weighting each of the 50 stocks (2% each) and is calculated using each stock’s opening price as of Friday morning each week. Entry prices and exit prices used for stocks that are added or removed from the Bespoke 50 are based on Friday’s opening price. Any potential commissions, brokerage fees, or dividends are not included in the Bespoke 50 performance calculation, but the performance shown is net of a hypothetical annual advisory fee of 0.85%. Performance tracking for the Bespoke 50 and the Russell 3,000 total return index begins on March 5th, 2012 when the Bespoke 50 was first published. Past performance is not a guarantee of future results. The Bespoke 50 is meant to be an idea generator for investors and not a recommendation to buy or sell any specific securities. It is not personalized advice because it in no way takes into account an investor’s individual needs. As always, investors should conduct their own research when buying or selling individual securities. Click here to read our full disclosure on hypothetical performance tracking. Bespoke representatives or wealth management clients may have positions in securities discussed or mentioned in its published content.
Reversals
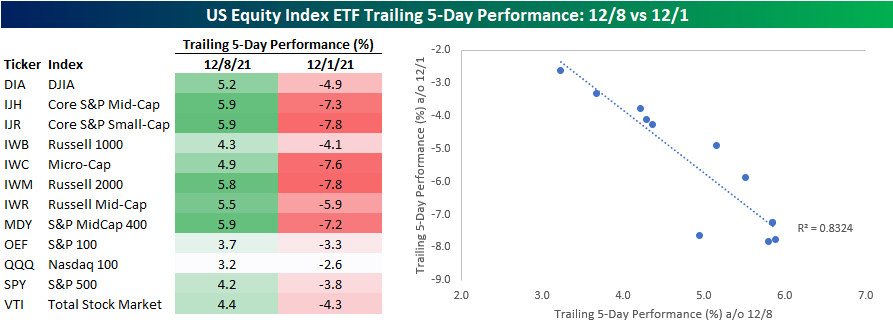
Earlier today in our Morning Lineup, we highlighted the fact that there has been a pretty remarkable about-face in market performance at the index level between now and a week ago. The table below compares the trailing 5-day performance of the major index ETFs as of the close on 12/8 versus the trailing 5-day performance as of the close on 12/1. Whether you look at the table or chart, it’s pretty clear to see that performance over the last five days has been directly related to performance in the week prior. Indices that were down the most last week have bounced back the most this week, and indices down the least last week are up the least this week. With an r-squared of 0.8324, you can’t get much more closely correlated than that.
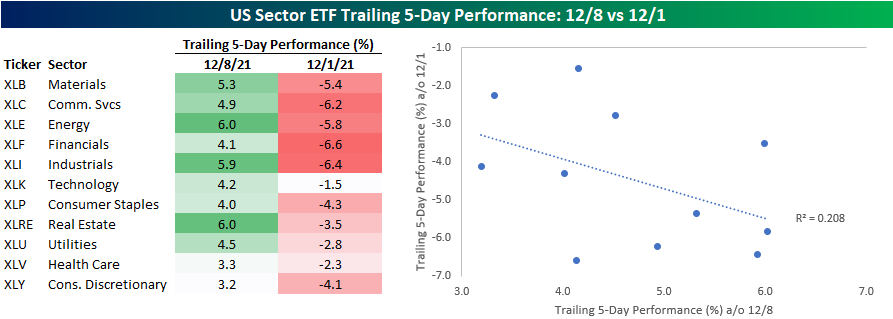
While there has been a close correlation between performance at the index level, at the sector level, the relationship — while still positive — hasn’t been nearly as strong. While some of the biggest losers in the week ending 12/1 like Industrials and Energy have been among the biggest winners over the last week, a sector like Real Estate that actually outperformed the S&P 500 in the week ending 12/1 is also one of the top-performing sectors over the last week. Additionally, Financials was the worst-performing sector on the way down last week with a decline of 6.6%, but it has also underperformed on the way up this week. As a result, while the r-squared of performance at the index level has been +0.83, the r-squared of performance at the sector level has been much lower at just +0.21. Click here to view Bespoke’s premium membership options.
Bespoke’s Morning Lineup – 12/9/21 – Then Again
See what’s driving market performance around the world in today’s Morning Lineup. Bespoke’s Morning Lineup is the best way to start your trading day. Read it now by starting a two-week trial to Bespoke Premium. CLICK HERE to learn more and start your trial.
“Indecision may or may not be my problem.” – Jimmy Buffett
After a strong start to the week, investors are taking a step back from buying this morning as futures are firmly negative and have been gradually weakening all morning. Following big losses right after Thanksgiving and then a sharp rebound over the last week, investors can’t seem to make up their minds.
The biggest news item of the day so far has been initial jobless claims which fell to an unheard of 184K which was well below the already low estimate of about 225K. As equities pull back, treasuries have been rallying with the 10-year yield back below 1.5%. The big economic data in the US will come tomorrow with the release of November CPI, but overnight in China, CPI came in weaker than expected on a y/y basis (2.3% vs 2.5% forecast).
Read today’s Morning Lineup for a recap of all the major market news and events from around the world, including the latest US and international COVID trends.
What a difference a week makes. Looking at how sector performance has changed over the last week provides a perfect illustration of indecisiveness in the equity market. The first snapshot below is from our Trend Analyzer from a week ago today (through the close on 12/1). At the time, every major index ETF was down at least 2.5% over the prior five trading days with the majority below their 50-day moving averages after trading at or near overbought levels just a week earlier. Mega-cap indices like the Nasdaq 100 (QQQ) and S&P 100 (OEF) were holding up best at the time while small and mid-cap stock indices were down over 7% in the span of just five trading days.

Fast-forwarding just a week, the picture has completely changed. Now, every major index ETF in the Trend Analyzer is up at least 3% over the last five trading days, and the majority are back above their 50-day moving averages. Leading the way higher, the same indices that were down the most have bounced back the greatest while mega-cap indices like the Nasdaq 100 (QQQ) and S&P 100 (OEF) are the only two that are up less than 4% over the last five trading days.

Start a two-week trial to Bespoke Premium to read today’s full Morning Lineup.
Performance by Region
The US has had an incredibly strong 2021, especially when considering the headwinds the economy faced. Supply chain constraints, labor challenges, inflation, energy shortages, high oil prices, and new COVID variants all hindered the global economy this year. Nonetheless, since the start of the year, the SPDR S&P 500 ETF (SPY) has rallied over 25% YTD. While the US has been able to withstand the many headwinds, the same can’t be said for the rest of the world. The average performance for all of the other regions we looked at (Europe, Australia, Africa, Asia, and Latin America) was a loss of 3.4%. In 2021, there has been a huge divergence between the performance of developed markets and emerging markets. The US, Europe, and Australia have seen YTD gains of 15%+, while Africa, Asia, and Latin America have all seen pretty sizable declines. The US is on track to outperform both the rest of the world and emerging markets for the fourth consecutive year. Click here to view Bespoke’s premium membership options.

Daily Sector Snapshot — 12/8/21
Chart of the Day – Tantrum in Treasuries
B.I.G. Tips – State Level Searches for COVID Tests (12/8/21 update)
Job Openings Surge
The BLS released October results of the Job Openings and Labor Turnover Survey this morning showing a significant uptick in job openings. Openings totaled 11.03 million in October, slightly below the record of 11.098 million from this past July. Openings rose by 431K month over month which ranks as the biggest one-month uptick since July and is in the 94th percentile of all monthly moves.

While the JOLTS data is insightful, it is released at a decent lag. Job listings website Indeed, however, offers a higher frequency (daily) dataset with more up-to-date readings with the latest data available through November 26th. As we discussed ahead of the JOLTS release in last night’s Closer, postings through this reading have been hitting new highs and are 57% above the February 2020 baseline reading. That comes with acceleration in new postings being put up on the site throughout the fall, but especially so in recent weeks.

Indeed also offers a breakdown based on industry. As shown below, there are four industries that currently have postings that are twice as high as they were pre-pandemic. Ironically, given the fair degree of labor market slack, the human resources sector continues to top the list with postings almost 120% above the baseline level. Loading & Stocks, Production & Manufacturing, and Software Development are the other most in-demand industries through late November. The other end of the spectrum continues to include many reopening sensitive areas like Hospitality and Tourism (which has also been on the decline in recent weeks as shown in the next chart below), though, these too are now all above baseline levels.
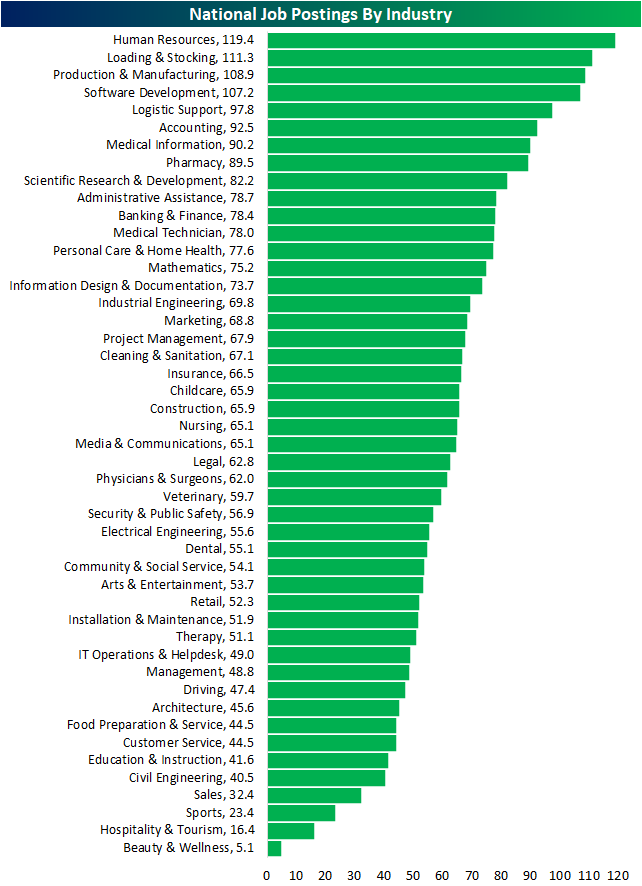
As previously mentioned, Hospitality and Tourism have seen a decline in postings recently likely as a result of rising case counts. Noting a few other industries, Banking & Finance, Construction, Cleaning & Sanitation, and Food Preparation & Service have all seen an acceleration in postings. Click here to view Bespoke’s premium membership options.
