Global COVID Cases
The Omicron variant has quickly become dominant across the globe, leading to surges in cases. With the higher transmissibility of this variant and the inability of vaccines to prevent infection, the seven-day average of new COVID cases has approached or even surpassed prior peaks in a number of countries. Click here to view Bespoke’s premium membership options.
In South Africa, ground zero of the Omicron variant, the seven-day average of daily new cases surged from basically zero to a record high in less than a month. In the three prior waves, on the other hand, the amount of time that elapsed from the time cases started rising until they peaked was twice as long at about two months. As quickly as the most recent wave caught fire, it already appears to have crested as the number of cases has already declined 22% in just three days! As shown in the chart below, following the peak in the three prior waves, it took an average of 9.3 days for the number of cases to drop as much or more than they have in this wave. According to Our World In Data, only 32% of the population has received at least one dose of the vaccine.

In the UK, the Omicron variant arrived as that country was still dealing with Delta, and the combined wave of those two strains has yet to peak. There are certainly seasonal trends at play here, and the combination of colder weather and the most transmissible variant yet has resulted in the seven-day average of cases surging 46.3% above the previous peak. The current rate of infection is the highest of the countries we’re highlighting in this post with 1,289 cases per million people. 77% of the UK population has received at least one dose of the vaccine.

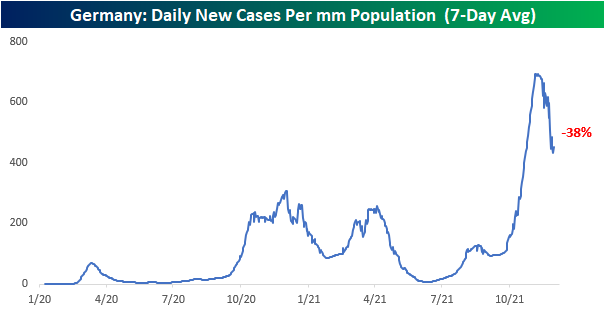
Cases in Germany have peaked already after more than doubling the previous peak’s daily average case count. Since this peak, the 7-day average has declined by 38%. Similar to South Africa, the case count appears to be declining substantially, giving credibility to the idea that Omicron is only a temporary phenomenon. 73% of the German population has received at least one dose of the vaccine.
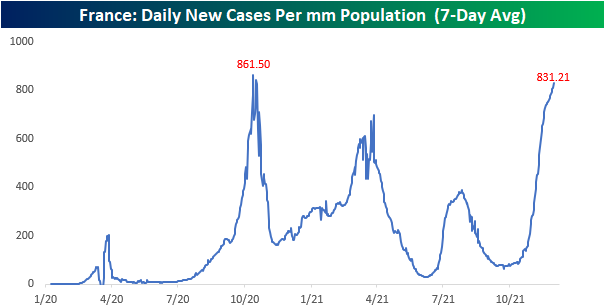
France’s case count is approaching its previous peak, but the rate of increase in cases is slowing somewhat since 12/8. 78% of the population has received at least one dose.
Spain is in a similar position to France but is yet to see a substantial decrease in the rate of new cases. The current rate is the highest since February and is ~15% below its all-time high from January. 83% of the Spanish population has received at least one dose of the vaccine.

The rate of infections in Italy is currently at the highest level since November of 2020 and the rate of new cases seems to only be accelerating. New cases are still 27% below their all-time high, but there are no signs of slowing yet. 81% of Italy’s population has received at least one dose of the jab.

Israel was the first country to approve a third dose of the COVID vaccine and just recently approved a 4th dose of the COVID vaccine for those 60 or older. Are COVID vaccine ‘subscriptions’ not far down the line? Cases are slowly rising but still very close to their lows. 70% of Israel’s population has received at least one dose.

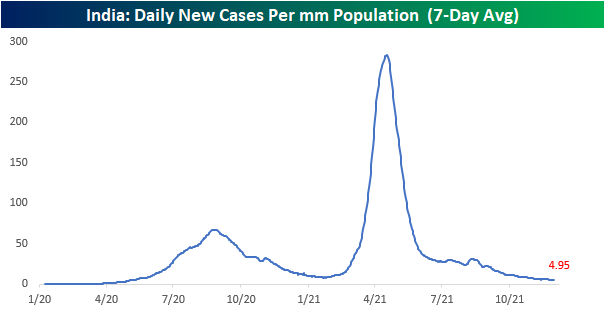
India was hit hard by the Delta variant but is yet to see cases tick higher amid the global spread of Omicron. Currently, the new case rate is near lows, and the last seven days have averaged just 4.95 cases per million, an extraordinarily low rate. Only 60% of India’s population has received at least one dose.
Cases in the United States are still below the prior two peaks, but with cases surging, that may not last long. Still, the seven-day average of new infections is 13% below the peak in September and 41% below the peak of last winter. The holiday season will likely lead to an increase in new cases as individuals travel and spend time indoors with family and friends, but then again, with the holidays in the rearview mirror, demand for tests will likely decline. 73% of the US population has received at least one dose.

Canada is already at peak levels of new cases and the slope of the increase is practically straight up. The combination of colder temperatures (more time spent indoors) and a highly transmissible variant has led to the spike seen in Canada, which is currently almost 4% above its previous highs. 83% of the Canadian population has received at least one dose, and the country has been strict in regards to COVID protocols.

Unlike its North American neighbors, Mexico is yet to see any increase, most likely due to warmer weather. Lower testing rates may also have an effect on this data. The current rate is very close to pandemic lows. 64% of the Mexican population has received one dose of the vaccine.

All-in-all, there seems to be little correlation between vaccination rates and new case rates, and factors like climate appear to be a far larger factor. Countries like Israel, Mexico, and India have new infection rates that are far below countries in the Northern Hemisphere with colder climates at this time of year. The UK, Spain, France, and Germany all have elevated levels of infection as a percentage of the population, and all of these countries have relatively high levels of vaccination. When it comes to getting infected, Omicron has shown an ability to evade vaccines, although some reports suggest that the infection is less severe.
Bespoke’s Morning Lineup – 12/22/21 – Slow Improvement
See what’s driving market performance around the world in today’s Morning Lineup. Bespoke’s Morning Lineup is the best way to start your trading day. Read it now by starting a two-week trial to Bespoke Premium. CLICK HERE to learn more and start your trial.
“In the business world, the rearview mirror is always clearer than the windshield.” – Warren Buffett
Since Thanksgiving, there has only been one trading day where the S&P 500 moved up or down less than 0.5%, but given where futures are trading this morning, there is some hope that this could be number two. This is a time of year where markets are supposed to be calm as investors focus on other things, but as we highlighted yesterday, this December has actually been the most volatile month of the year!
In order for this early calm to continue, though, we’ll have to get through a slug of economic data including the Chicago Fed National Activity Index, revised GDP, Consumer Confidence, and Existing Home Sales. On the Omicron front, we’ve heard anecdotal stories for weeks about how this strain is less severe than prior strains, but we’re now starting to get clinical evidence as a study from South Africa says that Omicron is 80% less likely to result in hospitalization than the Delta strain. That’s some good news!
Read today’s Morning Lineup for a recap of all the major market news and events from around the world, including the latest US and international COVID trends.
The Technology sector experienced a peak to trough pullback of just over 6% this month, but over the last two days, the sector bounced right at a key support level that coincided with the 50-day moving average and the recent lows in early and late November. As we close out the year, the sector will need to break above its recent highs to keep the uptrend intact, but if the current bounce stalls short of the recent highs, the sector could be in for a more extended period of churn.

Start a two-week trial to Bespoke Premium to read today’s full Morning Lineup.
Daily Sector Snapshot — 12/21/21
December Volatility Spike
December typically tends to be a month of lower stock market volatility following a period in late October and early November when volatility tends to peak. This year, however, has been quite different. As of yesterday’s close, the one-month rolling average of one-day absolute moves for the S&P 500 was 1.06%. (This means the S&P 500 has been averaging a daily change of +/-1%+ over the last month.) As shown in the dark blue line below, this has actually been the most volatile one-month period for all of 2021. As the light blue line shows, daily volatility for the S&P 500 is usually plummeting at this time of year as traders typically slow down dramatically around the holidays.

Since the 5-day trading week was established back in September 1952, December has historically been the least volatile month of the year, averaging an absolute daily change of 0.61%. This year, the average daily change since the start of December has been 1.07%, which is far above the next closest level seen in March 2021 (+/-0.83%). October, the month that has historically been the most volatile month of the year, ranked 6th in 2021.

So what tends to occur when volatility inverses its seasonal trend in December? Since 1953, there have been five prior years where December was the most volatile month of the year: 1973, 1978, 1985, 1995, and 2018. Below we show how the S&P 500 performed in January following the five prior years listed, and we also show the full next-year change. As shown, January was positive in four of five instances, and the one January that saw a decline was in 1974 when it fell only 1%. In the most recent occurrence, the 9.2% decline in December of 2018 was followed by a 7.9% move higher in January of 2019. In the following year, the median performance of the S&P 500 was +14.6%. Click here to view Bespoke’s premium membership options.

German Consumer Confidence
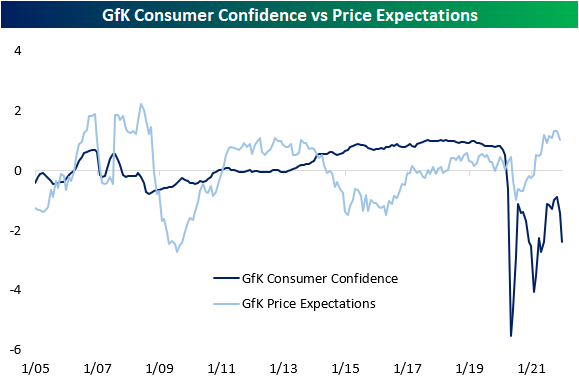
The GfK reading for German Consumer Confidence for January of 2022 was released this morning and came in at -6.8, continuing its roll-over from a recent post-COVID high. This is the second consecutive month-over-month decline and the lowest reading since June of 2021. At current levels, consumer sentiment in Germany remains well off its pre-COVID levels, and one factor behind the slower rebound (besides the fact that COVID won’t go away) could be what seems like a relentless increase in prices as supply chain issues persist and energy prices surge.

While prices have been rising, consumers seemingly expect the rapid rate of increase to be temporary as price expectations look to have peaked for the time being. It’s also worth pointing out in this chart that while sentiment levels are still well below pre-COVID levels, price expectations are well above pre-COVID levels.
Besides higher prices, rapidly rising numbers of COVID cases are obviously another factor weighing on consumer sentiment in Germany. In the chart below, we plot the monthly average number of COVID cases in Germany to Consumer Confidence since the start of 2020. While there has been a limited inverse relationship between the two series, the recent drop in sentiment against the surge in cases cannot be dismissed. Click here to view Bespoke’s premium membership options.

Chart of the Day – Pareto Principle in Market Cap Share
Bespoke’s Morning Lineup – 12/21/21 – Trying For a Turnaround
See what’s driving market performance around the world in today’s Morning Lineup. Bespoke’s Morning Lineup is the best way to start your trading day. Read it now by starting a two-week trial to Bespoke Premium. CLICK HERE to learn more and start your trial.
“The best stock to buy is the one you already own.” – Peter Lynch
It looks like we are going to at least try for a turnaround this Tuesday as US equity futures are all firmly in positive territory the morning after it was announced that the Omicron variant was now the dominant COVID strain in the US. If data released so far proves to be accurate, this is a good thing as this strain of COVID appears to be much weaker in severity than the Delta strain, even if it is more transmissible.
There’s no economic data on the calendar today, so there won’t be much in terms of specific potential catalysts to drive the market, but lately, the market hasn’t seemed to need excuses to move in one way or the other.
Read today’s Morning Lineup for a recap of all the major market news and events from around the world, including the latest US and international COVID trends.
They closed well off their intraday lows yesterday, but the major US averages still finished the day down more than 1%. For the S&P 500, yesterday’s bounce came right at support from the prior highs in early September, and the index did not take out its lows from early October. With futures higher this morning, bulls are hoping it marks the start of a year-end rally, but if yesterday’s lows don’t hold, the end of 2021 won’t be pretty.

While the S&P 500 hasn’t quite taken out its lows from October, the Nasdaq 100 did. Not only that, but even after yesterday’s rebound, QQQ remains below its highs from early September. That may change after today, but the index still has work to do before technicians will become more comfortable with the technical picture.

Start a two-week trial to Bespoke Premium to read today’s full Morning Lineup.
Daily Sector Snapshot — 12/20/21
Chart of the Day: Monday Down Opens
Bespoke’s Morning Lineup – 12/20/21 – 9…
See what’s driving market performance around the world in today’s Morning Lineup. Bespoke’s Morning Lineup is the best way to start your trading day. Read it now by starting a two-week trial to Bespoke Premium. CLICK HERE to learn more and start your trial.
“Times and conditions change so rapidly that we must keep our aim constantly focused on the future.” – Walt Disney
There are less than ten trading days left in 2021, but investors don’t appear to be in a positive mood to close out the year. Futures are kicking off the week on a down note again as all of the major averages are indicated to open down by 1% or more. Commodities are lower, the 10-year yield is lower, and international markets are under even more pressure than US stocks. The surge of the Omicron variant has really started to impact activity in regions where the numbers are rising as consumers stay home. While no one is expecting a return to the situation of Spring 2020, this time around the easy fiscal and monetary conditions that helped to grease the skids in the past aren’t around now.
Read today’s Morning Lineup for a recap of all the major market news and events from around the world, including the latest US and international COVID trends.
It’s not often that the S&P 500 drops more than 2% during a week but four out of eleven sectors actually finished the week 1% higher. That was the case last week, though, as the sheer size of Technology and Consumer Discretionary and their declines of more than 4% dragged the entire market lower. These two sectors weren’t even the worst performers as Energy’s plunge had a five-handle on it! On the upside, Health Care, Real Estate, Consumer Staples, and Utilities all rose more than 1%, but because of their relatively low weights in the S&P 500 (besides Health Care), it wasn’t enough to stem the drag of Tech and Consumer Discretionary.
Even after their respective declines last week, Technology and Consumer Discretionary are still both up more than 20% YTD while Energy’s gain is close to 50%. Concerns over the Omicron variant, a tighter Fed, and fiscal and monetary drags in 2022 have been the primary drivers weighing on investor sentiment, and the fact that many investors are sitting on enormous gains has them only more willing to take some profits.

Start a two-week trial to Bespoke Premium to read today’s full Morning Lineup.