Bespoke Market Calendar — February 2022
Please click the image below to view our February 2022 market calendar. This calendar includes the S&P 500’s average percentage change and average intraday chart pattern for each trading day during the upcoming month. It also includes market holidays and options expiration dates plus the dates of key economic indicator releases. Start a two-week free trial to one of Bespoke’s three research levels.

Chart of the Day – No Ballast From Bonds During Stock Rout
Bespoke’s Morning Lineup – 2/1/22 – TGIF
See what’s driving market performance around the world in today’s Morning Lineup. Bespoke’s Morning Lineup is the best way to start your trading day. Read it now by starting a two-week trial to Bespoke Premium. CLICK HERE to learn more and start your trial.
“To be successful in life, you must get in the habit of turning negatives into positives.” – George Foreman
The last two trading days of the month helped to soften the blow, but a lot of people are probably happy to turn the page on January and start a new month. Futures are mixed to kick off the month with the S&P 500 and Dow futures modestly lower while the Nasdaq is slightly higher. Major economic reports today will include the ISM Manufacturing report, Construction Spending, and JOLTS which will all be released at 10 AM. In the case of all three reports, this morning’s prints are expected to show some deceleration relative to last month’s readings.
We’ve already seen a decent number of earnings reports this morning with UPS trading up sharply after reporting an earnings triple play, but this afternoon will be even busier with Alphabet (GOOGL) headlining. Other notables will include General Motors (GM), Starbucks (SBUX), PayPal (PYPL), and AMD.
Read today’s Morning Lineup for a recap of all the major market news and events from around the world, including the latest US and international COVID trends.
The Nasdaq was looking at a loss of more than 10% heading into the final trading day of January, but Monday’s 3%+ rally moderated the decline to a still steep 8.98%. With a rally of more than 6% in the month’s last two trading days, January was only the sixth month in the Nasdaq’s history where the index rallied more than 5% in the final two trading days of the month. Before January, the last occurrence was more than twenty years ago in May 2000. As shown in the table and chart below, back around the peak of the dot-com bubble there were actually three different occurrences in the span of less than a year, and before that, you had to go back to October 1987. The only other occurrence was in March 1980.

Start a two-week trial to Bespoke Premium to read today’s full Morning Lineup.
Daily Sector Snapshot — 1/31/22
Chart of the Day: Spikes in Oil and Interest Rates
Meme Stock Mania Anniversary
Last week was the most recent update of short interest data through mid-January, and that came on the one-year anniversary of the height of the meme stock mania when highly shorted stocks like GameStop (GME) experienced historic short squeezes. The year since then has not been kind to heavily shorted names. The Bloomberg High Short Interest index tracks the 100 US stocks with the highest short interest as a percent of float with monthly rebalancing. As shown below, since the height of meme stock mania on January 27th of last year, this basket has now been more than cut in half!

Although highly shorted stocks have performed terribly in the past year, the level of short interest across multiple industry groups is well below where it stood prior to last year’s short squeeze. As shown below, levels of aggregate short interest for each industry group were little changed in the first two weeks of the year, but are also a fraction of what they were at the end of 2020.

Below we show the stocks that currently have the highest levels of short interest of Russell 3,000 members. Prelude Therapeutics (PRLD) tops the list with more than 80% of float shorted. That is actually down slightly versus the last reading through the end of 2021. Cue Health (HLTH) and IGM Biosciences (IGMS) are the only other stocks with over half of their shares shorted. Those two, as well as several other highly shorted stocks, are down over 30% in January. The two worst decliners are Citi Trends (CTRN) with a 46.8% loss and Cortexyme (CRTX) which has nearly been cut in half. As for the meme stock mania posterchild GameStop (GME), it now ranks as the 209th most heavily shorted stock.
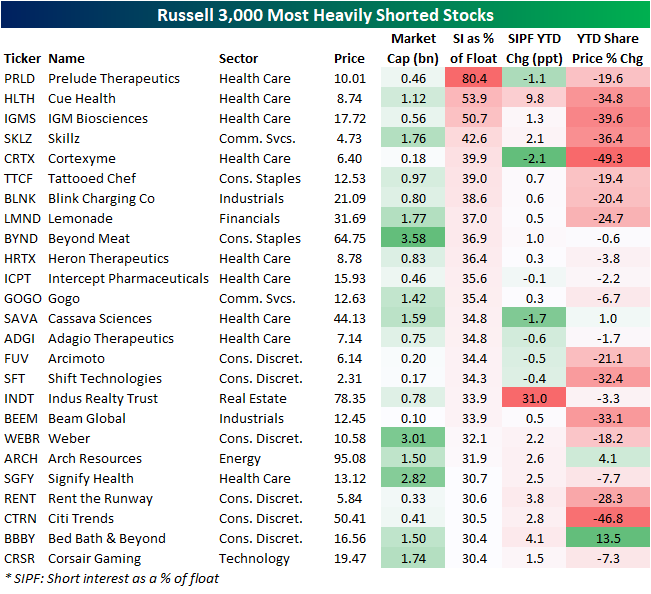
Indus Realty Trust (INDT) also finds itself high up on the list of highly shorted stocks, but that is a recent change. Its short interest has surged 31 percentage points in the first half of January on what has been a relatively small stock price decline in the same time. NETSTREIT (NTST), Codex DNA (DNAY), and Cresent Energy (CRGY) are the only other stocks to have seen double-digit percentage point jumps in short interest so far in 2022. Want more in-depth analysis from Bespoke? Click here to view Bespoke’s premium subscription options.

Bespoke’s Matrix of Economic Indicators – 1/31/22
Our Matrix of Economic Indicators provides a concise summary analysis of the US economy’s momentum. We combine trends across the dozens and dozens of economic indicators in various categories like manufacturing, employment, housing, the consumer, and inflation to provide a directional overview of the economy.
To access our newest Matrix of Economic Indicators, start a two-week free trial to either Bespoke Premium or Bespoke Institutional now!
Massive Month-End Buying of Biggest Losers
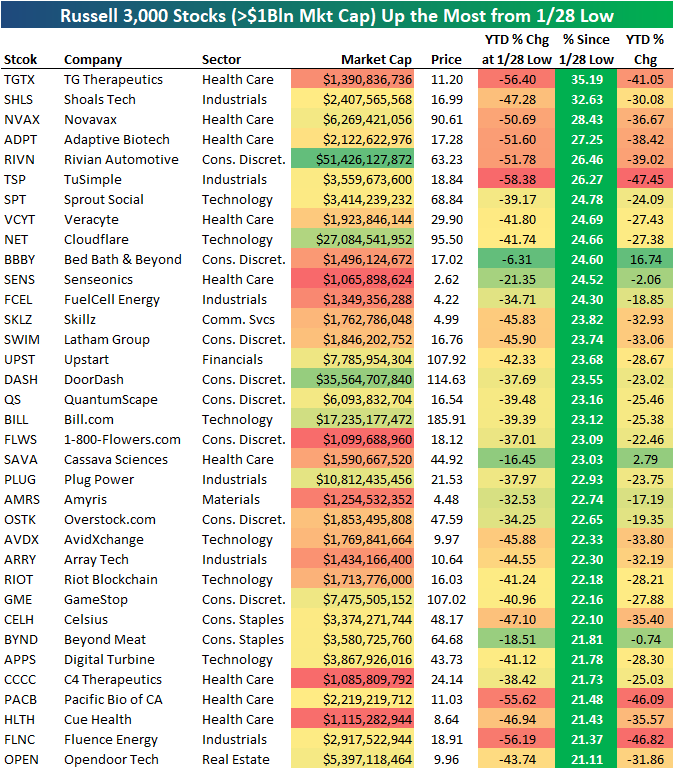
The average stock in the Russell 3,000 is now up 7% from the index’s low point last Friday (1/28) as we near the final close of January 2022. We have seen some massive rallies since Friday morning when US markets started the day in the red. Below is a look at the Russell 3,000 stocks with market caps >$1 billion that are up the most since their intraday lows last Friday. For each stock, we also show how it had performed on a year-to-date basis at its low point last Friday. What we see here is that the stocks that are up the most during this two-day month-end rally are generally the same ones that were down the most YTD heading into the rally. The six stocks that are up the most since their lows on Friday are up 26%+, but five of the six were down 50%+ YTD at their lows! A 50%+ YTD decline usually takes more than a month to play out, but not this year! And 25%+ rallies usually take more than two trading days to play out as well.
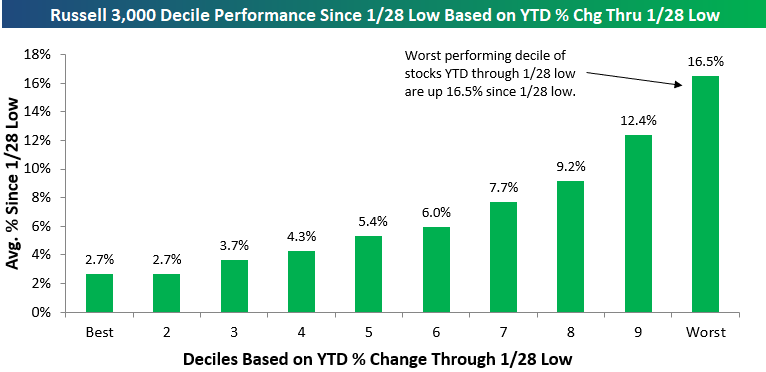
If we break the Russell 3,000 into deciles based on YTD performance through the low on Friday (1/28), we can clearly see that the stocks that were down the most YTD are the ones bouncing back the most. The 10% of stocks in the Russell 3,000 that were down the most YTD at the low on 1/28 are up an average of 16.5% since. Conversely, the 10% of stocks in the index that were doing the best YTD at their low point last Friday are only up 2.7% since then.
Below is a look at the rally off last Friday’s lows by sector. The average Health Care stock was down 25%+ YTD at last Friday’s low, but they’re now up more than 10% since then. Tech stocks were down nearly 20% YTD on average through last Friday’s lows, and they’re up 9.8% since.
We would note that the Energy sector is the only one that saw stocks up YTD through last Friday’s low, and they have tacked on a gain of 3.8% since then for a full-year average gain of 8.44%. Stay on top of market trends by becoming a Bespoke subscriber today. Click here to view Bespoke’s premium membership options.


The Rogan Rollercoaster
Any publicity is good publicity, right? When it comes to the world’s largest podcast and the company that hosts it, that seems to be holding true at least for today. As of this writing, Spotify (SPOT) is trading up double-digits versus Friday’s 52-week low for its fifth-best day on record since its IPO as the company has been in a whirlwind of headlines over the past week. Those headlines concern comedian Joe Rogan’s Spotify exclusive podcast, The Joe Rogan Experience, and the controversy it has caused due to artists like Neil Young pulling their music from the platform citing COVID misinformation on Rogan’s podcast. While there have been a slew of headlines in the past few days coinciding with huge moves in SPOT’s stock, it is not the first time this has happened.
In the chart below, we show Bloomberg and other major news agency headlines concerning Joe Rogan, his show, and Spotify over the past two years. Since Spotify and Joe Rogan first struck a deal to have the podcast exclusively on the platform in May 2020, headlines surrounding the show have at multiple points resulted in huge swings in the stock. When news of the deal first hit the tape, the stock soared and then soared again even more substantially roughly a month later as analysts upgraded the stock in response to the deal. In fact, that response to upgrades resulted in the stock’s third-best single-day gain on record. From May 2020 before the deal was announced to the highs later that summer in July, SPOT would rise from around $150 to a little under $300. After a few months of consolidation, including a sharp but short-term drop when Spotify staff gave pushback on Alex Jones’ appearance on Rogan’s show, the stock surged again on strong earnings partially accredited to the addition of the podcast. SPOT then erased much of those gains in early 2021, and more backlash over COVID “misinformation” again sent the stock lower last spring. While the last earnings report in the fall saw the stock spike higher, it quickly reversed lower and the recent onslaught of headlines resulted in a 52-week low on Thursday, leaving SPOT at similar levels to when the Joe Rogan deal first went through.


While there is some overlap with earnings, as previously mentioned, days in which Spotify and Joe Rogan find themselves in the news have coincided with some of the stock’s largest single-day moves or highest volumes. In fact, today is on pace to be the third-best day since the deal with Joe Rogan went through and volumes in the past several days have sat around the 90th percentile of all days since the stock’s IPO.

The most recent string of headlines have hit the tape with only a few days left before the company reports Q4 results. Using data from our Earnings Explorer tool, SPOT has historically traded weak in response to earnings. Since its IPO in 2018, there have only been four quarters in which the stock had a positive one-day reaction to its earnings report. One of those was last quarter when the stock rose 8.3%. When it comes to Q4 specifically, the stock has yet to react positively to earnings and the stock’s average decline has been the weakest of any quarter averaging a decline of 5.21%. Click here to view Bespoke’s premium membership options.

Nasdaq Drops Over 10 Percent in January
As of 10 AM this morning, the Nasdaq has shed over 10% in January, which would mark the first full-month decline of over 10% since March of 2020. Before the COVID-induced crash, the Nasdaq had not lost 10% in a calendar month since November of 2008. When the dot-com bubble popped at the beginning of the 21st century, 8 months saw declines of more than 10%.

Short-term forward performance has been relatively mixed following prior 10%+ monthly drops for the Nasdaq. On the first day of the following month, the Nasdaq has averaged a gain of 10 basis points with positive returns 54% of the time. The first week of the next month has seen the index average a gain 10 basis points as well with positive returns 54% of the time, while the next month has seen an average gain of 50 basis points with positive returns 50% of the time.
Looking further at next-month returns, the maximum upside seen since the index was created after one of these occurrences was +17.2% (Oct. 1974) and the maximum downside was -17.7% (Oct. 2008). The average absolute change for the next month is 10.7%, which is significantly above the average for all periods (+/-4.6%). Just like much of the research we have published over the last few weeks has found, this data suggests that more volatility should be expected in February.
Looking at the most recent 10%+ monthly drop in March 2020, the Nasdaq started April 2020 with a huge decline of 4.4% (on April Fool’s Day), but by the end of the month, the index was up 15% MTD. Prior to March 2020, the Nasdaq amazingly had back-to-back-to-back 10%+ monthly declines in September, October, and November 2008. Stay on top of market trends by becoming a Bespoke subscriber today. Click here to view Bespoke’s premium membership options.
