New Year’s Resolution for Rotation
While the broad S&P 500 (SPY) is trading slightly higher to start the new year, individual sectors are mixed and experiencing some pretty extreme moves. Energy (XLE) and Consumer Discretionary (XLY) are surging out of the gate with both sectors gaining over 2% today. For Consumer Discretionary, the bulk of its 2% gain today is thanks to Tesla (TSLA). While TSLA is up more than 10% on the day, the majority of stocks in the Consumer Discretionary sector are down on the day. The Financials sector (XLF) is also up over 1%, while Technology (XLK) and Communication Services (XLC) are both up ~0.6%. Conversely, Industrials (XLI), Utilities (XLU), Materials (XLB), Health Care (XLV), and Real Estate (XLRE) are all down well over 1%.

Rotation out of last month’s winners appears to be the big driver of today’s move. In the chart below, we show each sector ETF’s performance today plotted against performance in the month of December. As shown, last month’s biggest winners are all in the red in today’s session. Defensive sectors, in particular, are down the most today whereas last month they rallied high single to double digits. Meanwhile, cyclicals were up more modestly last month and are today’s biggest winners. Click here to view Bespoke’s premium membership options.
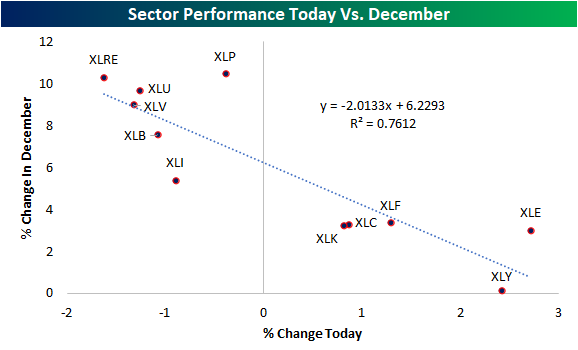
Chart of the Day: January 2022 Seasonality
Bespoke Market Calendar — January 2022
Please click the image below to view our January 2022 market calendar. This calendar includes the S&P 500’s average percentage change and average intraday chart pattern for each trading day during the upcoming month. It also includes market holidays and options expiration dates plus the dates of key economic indicator releases. Start a two-week free trial to one of Bespoke’s three research levels.

Bespoke’s Matrix of Economic Indicators – 1/3/22
Our Matrix of Economic Indicators provides a concise summary analysis of the US economy’s momentum. We combine trends across the dozens and dozens of economic indicators in various categories like manufacturing, employment, housing, the consumer, and inflation to provide a directional overview of the economy.
To access our newest Matrix of Economic Indicators, start a two-week free trial to either Bespoke Premium or Bespoke Institutional now!
Green on the First Day of the Year
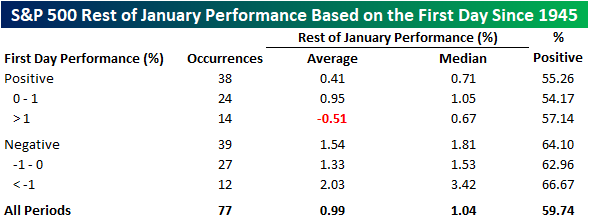
The S&P 500 opened higher on the first trading day of 2022 and is up about 20 basis points (bps) as of 11 AM. It’s widely assumed that positive starts to the year portend good things for the rest of the month, but the data doesn’t necessarily show that. The table below shows the S&P 500’s performance since 1945 for the remainder of January based on how it trades on the first day of trading. Based simply on whether or not the first day of trading is positive or negative, in the 38 years since 1945 where the year started off with a gain, the average rest of month performance was an additional gain of 0.41% (median: 0.71%) with gains just over 55% of the time. In the 39 years where the year started off with a decline, though, performance for the rest of the month was much stronger with an average gain of 1.54% (median: 1.81%) and positive returns 64.1% of the time.
When we filter out by years where the S&P 500 gained or lost 1% on the first day of trading in January, returns for the rest of the month were even more skewed. In the 14 years where the S&P 500 was up 1% on the first day of trading, the average performance for the rest of the year was a decline of 0.51% (median: +0.67%) and positive returns 57% of the time. Conversely, in the 12 years where the first day of the year experienced a decline of 1%+, the average rest of month performance was a gain of 2.03% (median: 3.42%) with positive returns two-thirds of the time. Broadly speaking, therefore, there is little evidence that strong starts to a year are a precursor of a strong January and vice versa.
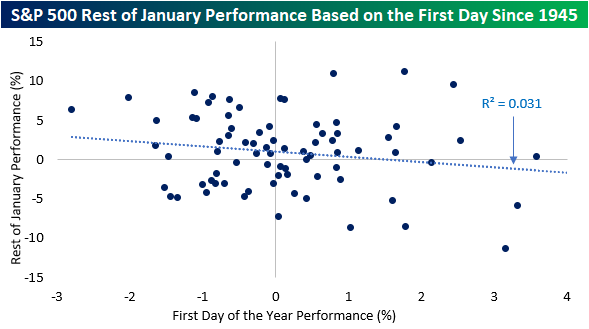
As you can see from the dot plot below, first-day performance tends to have a relatively minimal effect on the rest of the month’s performance. Only about 3.1% of the variance seen in the y variable (rest of January performance) is explained by movements in the x variable (first-day performance). Nonetheless, the slope of the linear line of best fit is still negative, so there is a slight negative correlation between the two variables. Click here to view Bespoke’s premium membership options.
Bespoke’s Morning Lineup – 1/3/22 – Starting Over
See what’s driving market performance around the world in today’s Morning Lineup. Bespoke’s Morning Lineup is the best way to start your trading day. Read it now by starting a two-week trial to Bespoke Premium. CLICK HERE to learn more and start your trial.
“For last year’s words belong to last year’s language and next year’s words await another voice.” – T.S. Eliot
It’s a new year, but things look a lot now like they looked in 2022 with markets in rally mode and COVID cases continuing to surge. There’s little in the way of catalysts driving this morning’s rally, and outside of the US, many international markets were closed in observance of the new year. The economic calendar is light today with Markit’s final read on the manufacturing sector scheduled for release at 9:45 while Construction Spending is on tap at 10 am.
Read today’s Morning Lineup for a recap of all the major market news and events from around the world, including the latest US and international COVID trends.
For the next several minutes, every sector is on an equal footing with respect to year-to-date performance, but below we wanted to provide a last look at where things stood to close out 2021. Topping the list in terms of sector performance was Energy (XLE) with a gain of more than 50%. Despite the strong year, though, Energy was one of just three sectors to finish below its 50-day moving average (along with Financials-XLF and Communication Services-XLC). Real Estate (XLRE), on the other hand, was the second-best performing sector of 2021, but it finished the year on a positive note gaining over 3.5% in the final week of the year and at more overbought levels than any other sector. At the other end of the spectrum, Communication Services, Consumer Staples (XLP), and Utilities (XLU) were the only three sectors to finish the year up less than 20%, but of those three, strong finishes for both Utilities and Consumer Staples left those two sectors among the most overbought of all the sectors.

Start a two-week trial to Bespoke Premium to read today’s full Morning Lineup.
Bespoke Brunch Reads: 1/2/22
Welcome to Bespoke Brunch Reads — a linkfest of the favorite things we read over the past week. The links are mostly market related, but there are some other interesting subjects covered as well. We hope you enjoy the food for thought as a supplement to the research we provide you during the week.
While you’re here, join Bespoke Premium with a 30-day free trial!
COVID Country
America’s Mixed Response to the Omicron Variant Comes Down to Geography by Jennifer Levitz, Jimmy Vielkind, and Nicole Friedman (WSJ)
Whether you’re cancelling plans and bunkering down or forging ahead as usual amidst a national surge in Omicron cases largely depends on which part of the country you’re living in. Northern urban areas that contain a very large share of the US population are being much more careful than Southern and more rural locales. [Link; paywall]
Beleaguered by Omicron, New York Operates at Half Speed by Andy Newmann and Dana Rubinstein (NYT)
While the latest COVID variant hasn’t led to a huge increase in deaths or even hospitalizations, that hasn’t stopped it from wrecking havoc on New York City’s rhythm, as infected workers are forced to stay home and the health care system struggles to digest the huge number of tests and new cases that are popping up. [Link; soft paywall]
COVInnovations
US Army Creates Single Vaccine Against All COVID & SARS Variants, Researchers Say by Tara Copp (Defense One)
Army researchers at Walter Reed have designed a novel vaccine which would allow recipients to be exposed to up to 24 different discrete pathogens, which could each be a distinct variant. Trials are very early, so this is a long way from being a usable inoculation. [Link]
To Track Covid-19 Surges, Scientists Are Studying Sewage by Josh Ulick (WSJ)
COVID patients excrete a steady stream of the virus when they’re infected, and changes in the background viral load from sewage can indicate the number of people in a population that are infected. The data is a useful real-time tracker for keeping an eye on the severity of outbreaks. [Link; paywall]
New Tech, Old Problems
Walmart drew one in four dollars spent on click and collect — with room to grow in 2022 by Melissa Repko (CNBC)
“Click and collect” or curbside pickup is a space dominated by Wal-Mart, with one of four dollars spent online for collection at stores captured by retail giant and equivalent to $20.4bn in total sales. [Link]
San Francisco-based DoorDash is requiring engineers to deliver food — and they’re furious by Joshua Bote (SFGate)
DoorDash employees are being told they have to use the tools they work on by stepping in to the driver’s seat and dropping off customer orders once per month. The practice is a return to the company’s roots, and was paused earlier in the COVID pandemic. [Link]
EV Industry
How Elon Musk’s Software Focus Helped Tesla Navigate Chip Shortage by Rebecca Elliott (WSJ)
Despite brutal semiconductor shortages that have wrecked havoc on the rest of the industry, Tesla has increased production by 80% this year. Software flexibility that allowed the use of alternative chips to fill supply gaps were a huge factor that allowed the company to keep factories rolling. [Link]
Rio Tinto Buys $825 Million Lithium Project in Battery Push by Thomas Biesheuvel and Yvonne Yue Li (Bloomberg)
Mining companies are scooping up supplies of lithium, copper, and other metal inputs that will help fuel the energy transition. The latest major transaction saw global giant Rio Tinto purchase an Argentinian lithium mine. [Link; paywall, auto-playing video]
Foreign Affairs
The Olympics Are Coming to China. So Is Omicron. by Louise Radnofsky, Rachel Bachman, and Ben Cohen (WSJ)
As Omicron floods across the world, the Winter Olympics in Beijing are facing an enormous public health challenge as they try to balance athletics with contained spread of COVID. [Link; paywall]
Turkey’s Currency Crisis Slams the Nutella Global Supply Chain by Jared Malsin (WSJ)
About 70% of the global hazelnut crop comes from Turkey, and the collapse of the lira is making it impossible for the country’s exporters to cover their costs of fertilizer, seeds, pesticides, and other inputs despite access to foreign currency revenues. [Link; paywall]
Bribery Doesn’t Pay
Minority Retort by Elsa Walsh (The NYer)
A 2005 profile of Nevadan Harry Reid, a giant of the state’s politics that passed this week. It includes a hilarious anecdote involving a sting operation against a casino man trying to bribe a much younger Reid. [Link]
Crypto
Crypto assets inspire new brand of collectivism beyond finance by Miles Kruppa and Hannah Murphy (FT)
Decentralized Autonomous Organizations, or DAOs, are a blockchain-powered form of social organization that goes beyond cryptocurrency in an attempt to improve on traditional forms of governance. [Link; paywall]
Demographics
2021 on track to surpass last year as nation’s deadliest by Mike Stobbe (AP)
The COVID pandemic sent the number of deaths in the US soaring and as a result life expectancy fell dramatically. As COVID has continued to rage, 2020 is likely to be surpassed by 2021 in terms of record deaths. [Link]
Read Bespoke’s most actionable market research by joining Bespoke Premium today! Get started here.
Have a great weekend!
B.I.G. Tips – 2021 Market Recap
Daily Sector Snapshot — 12/30/21
Dogs of the Dow End of 2021 Update
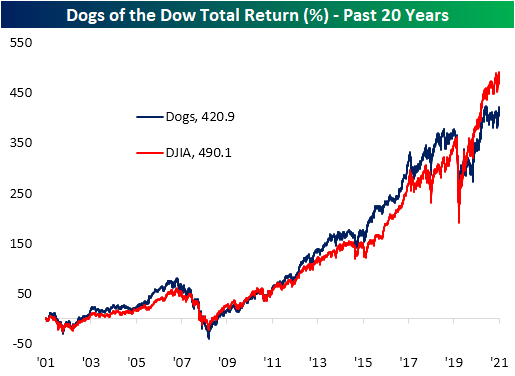
The Dogs of the Dow is a very simple and passive strategy with the basic concept being to buy the ten highest yielders of the Dow 30 at year’s end and repeating the process annually. In 2021, the only Dog of the Dow that did not finish the year higher was Verizon (VZ) which shed 7.53% on a total return basis. On average across these names, the strategy would have returned 16.3%. That compares to a 20.69% return for the rest of the index. As we close out 2021, the only change to the Dogs of 2021 for next year is that Cisco (CSCO) which now yields 2.33% will drop out and be replaced by Intel (INTC) with its yield of 2.70%.

In the chart below, we show the cumulative total return of this strategy versus holding the entirety of the Dow going back over the past twenty years. Historically, the Dogs have tended to outperform the broader index, but since the pandemic hit, that has not been the case. Not only have the non-dogs been outpacing the highest yielding stocks in the index, but the dogs of the Dow have yet to break out (though they are getting close after the past few day’s rally) from the range that has been in place since early June. Click here to view Bespoke’s premium membership options.