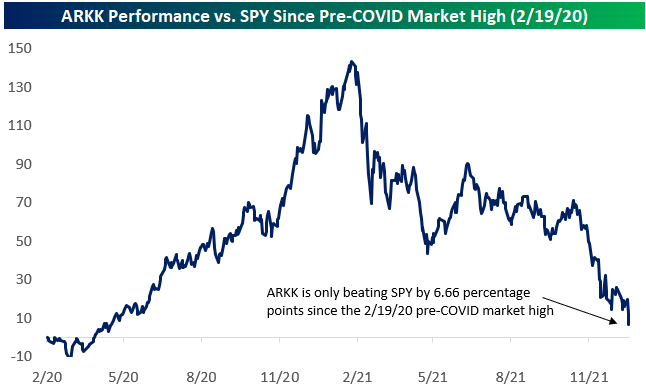
ARK Innovation (ARKK) Now Underperforming QQQ Since the Pre-COVID Peak
After further declines to start 2022, the ARK Innovation ETF (ARKK) is now up just 47.3% since the pre-COVID peak for the US equity market on 2/19/20 and is now only beating the S&P 500 by 6.66 percentage points since the pre-COVID high. Not only that, but it’s also underperforming the Nasdaq 100 (QQQ) by 17.9 percentage points.
ARKK was the envy of the industry in the year or so after the pandemic hit. Fund assets for the ARKK ETF went from $2.4 billion prior to COVID up to $28.5 billion at its peak last February. At its high, ARKK was absolutely crushing both SPY and QQQ. On 2/12/21, ARKK was outperforming SPY by 143 percentage points since the 2/19/20 pre-COVID peak for the stock market and beating the more tech-heavy Nasdaq 100 by 117 percentage points. Since its peak, ARKK has dropped more than 43%, allowing the more steady SPY and QQQ to catch up. Talk about a real-life “tortoise and the hare” scenario!
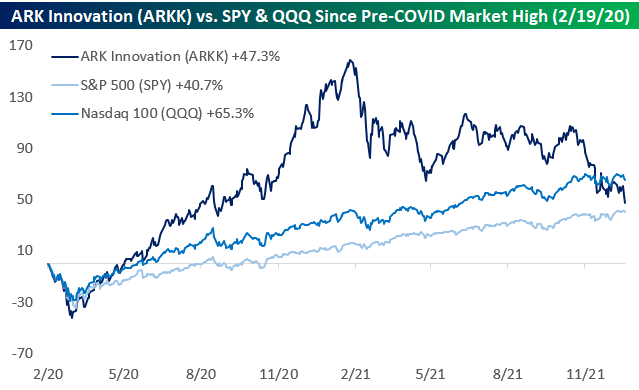

Interestingly, if we look at ARKK’s annualized price change from its launch in October 2014 through the pre-COVID peak for the stock market on 2/19/20, it’s roughly the same as ARKK’s annualized price change since the 2/19/20 pre-COVID peak: ~22.8%. Also, throughout its history, ARKK’s annualized total return still stands at ~24.3%, which is nearly 10 percentage points better than SPY’s annualized total return of 14.8% over the same time frame. Click here to view Bespoke’s premium membership options.

Bespoke’s Morning Lineup – 1/5/21 – More Pain For the Nasdaq
See what’s driving market performance around the world in today’s Morning Lineup. Bespoke’s Morning Lineup is the best way to start your trading day. Read it now by starting a two-week trial to Bespoke Premium. CLICK HERE to learn more and start your trial.
“Never confuse movement with action.” – Ernest Hemingway
After a snowstorm paralyzed the mid-Atlantic region earlier in the week, there’s not a lot of movement on roads in the Northeast this morning, but it is nothing compared to what drivers faced in the Virginia area. Futures are generally stalled out this morning as well with Dow and S&P 500 futures flat on the morning, while Nasdaq futures are firmly in the red, pointing to more weakness ahead for tech and growth stocks.
The major economic data release of the morning was the ADP Private Payrolls report which came in at 807K and was nearly double consensus expectations, and now the focus will shift to FOMC minutes from the December meeting at 2 PM Eastern.
Read today’s Morning Lineup for a recap of all the major market news and events from around the world, including the latest US and international COVID trends.
We’re only two trading days into the year, but already there’s been a lot of action. Within the S&P 500, more than one hundred stocks have moved 5% YTD (72 stocks up 5%+ and 30 down 5%+). At the sector level, the moves have also been monstrous. The Energy sector is up 6.66% (welp) while Financials has rallied 3.88%. For both sectors, the YTD gains already rank as the best two-day starts to a year since at least 1990. On the downside, three sectors have also declined at least 1% with Health Care leading the way lower falling by 2.35%.
With 9.01 percentage points separating the best and worst-performing sectors, the YTD performance gap after two trading days is one of the widest since 1990. The chart below shows the performance gap between the best and worst-performing sectors on a YTD basis after just two trading days. During this span, the average gap has been 5.2 percentage points, but the current gap of just over 9 percentage points is the widest since 2002 when 9.36 percentage points separated the performance of Technology (+8.19%) and Health Care (-1.16%). The widest performance spread between two sectors after just two trading days was in 2001 when 18.7 percentage points separated the 10.2% rally in Telecom Services from the 8.5% decline in Utilities. 2001 was also a year when the Fed announced a surprise rate cut as the dot-com bubble was bursting. Don’t think we have to worry about one of those coming any time soon.
Turning back to the Energy sector, not only is its 6.66% YTD gain the best for that sector since 1990, but it is also the best two day start for any sector since 2002. That’s a lot of Energy!

Start a two-week trial to Bespoke Premium to read today’s full Morning Lineup.
Daily Sector Snapshot — 1/4/22
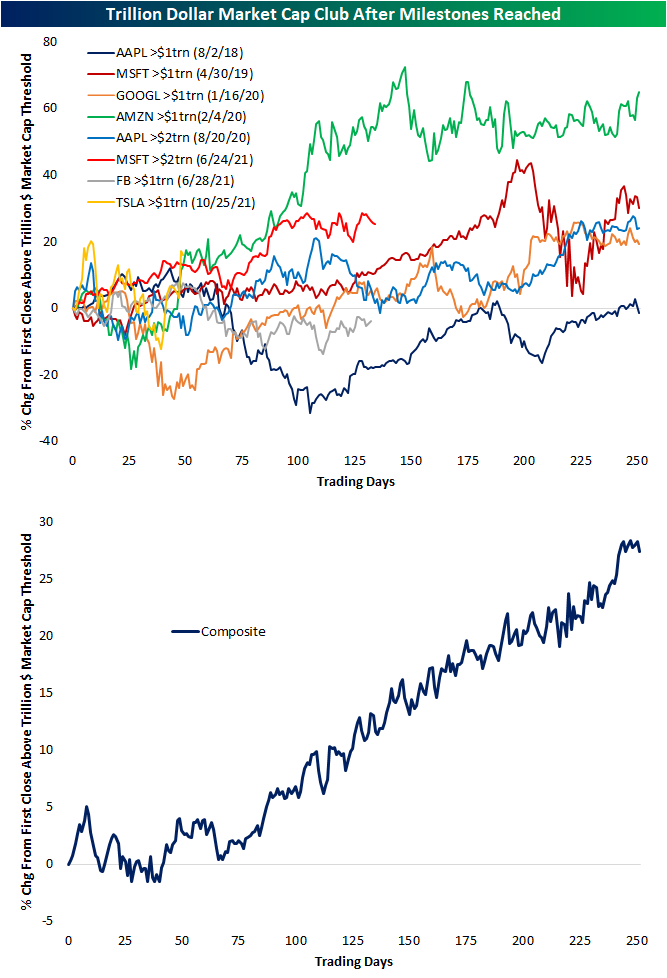
Trillion Dollar Thresholds
Back in August 2018, AAPL became the founding member of the trillion-dollar market cap club here in the US. In the time since then, membership has grown by five, though, only four other stocks currently have market caps above $1 trillion: Microsoft (MSFT) at $2.5 trillion, Google (GOOGL) at $1.95 trillion, Amazon (AMZN) at $1.7 trillion, and Tesla (TSLA) at $1.19 trillion. Facebook (FB) also crossed the $1 trillion threshold halfway through last year, but it has since turned lower. Yesterday, AAPL was the talk of the town as its market cap briefly touched above $3 trillion, though, those levels did not hold and the stock has still yet to close with a market cap above that level. While it has only spanned a few years’ time, there is now a decent sample size of stocks to look back on for past examples of how they perform after hitting the trillion-dollar market cap milestone.
In the chart below, we show the performance of the various mega-cap stocks following their first close with a market cap above $1 trillion (or $2 trillion where applicable). Generally speaking, after reaching such a milestone, the general pattern has been some consolidation lasting upwards of a few months followed by a more consistent resumed uptrend one year out from the occurrence. Amazon (AMZN) has averaged the strongest such response, though, its timing coincided nearly perfectly with the COVID crash (peak on 2/19/20) and the initial stages of the current bull run. Alphabet (GOOGL) is a similar story though it took longer to recover.
With regards to AAPL and the times it hit a $1 trillion and then a $2 trillion dollar market cap, the former instance saw an immediate strong reaction in the following months followed by weaker performance over the next 3 to 12 months. On the other hand, the more recent occurrence in which it crossed a $2 trillion market cap saw a brief spike higher over the next few weeks before moving back below $2 trillion for the span of a few months. That level would then offer support roughly six months later. Click here to view Bespoke’s premium membership options.
Bespoke Stock Scores — 1/4/22
Premium for Defensives
Each night in our Sector Snapshot, we show each sector’s P/E ratio as a percentile of their respective ten-year range. Given their surge in the final months of 2021, by far the most elevated valuations (as measured by the trailing P/E) are for defensive sectors like Consumer Staples and Utilities as well as Tech. Each of those is in the top one or two percentiles of their ten-year ranges. Conversely, Financials, Energy, and Materials have much less elevated multiples relative to their own ranges. Financials is the most extreme of these currently in the just the 39th percentile.

Below we show the spread in valuation between the averages (both in equal weight and sector weighted) for the P/E ratios for all defensive sectors (Consumer Staples, Health Care, Real Estate, and Utilities) versus all cyclical sectors (Communication Services, Consumer Discretionary, Energy, Financials, Industrials, Materials, and Technology). For this analysis, P/E ratios are expressed as z-scores or standard deviations from the historical norm. The picture shows that while defensive sectors have seen their valuations rise relative to cyclicals in a significant way, compared to the rest of history, it is not exactly extreme on either an equal weight or market cap-weighted basis. Click here to view Bespoke’s premium membership options.

Chart of the Day – Big Drop in Prices Paid
B.I.G. Tips – Downtrends To Watch in January
Bespoke’s Morning Lineup – 1/4/22 – Two in a Row?
See what’s driving market performance around the world in today’s Morning Lineup. Bespoke’s Morning Lineup is the best way to start your trading day. Read it now by starting a two-week trial to Bespoke Premium. CLICK HERE to learn more and start your trial.
“While you’re saving your face, you’re losing your ass.” – Lyndon Johnson
Futures are modestly higher this morning despite more record numbers of Covid cases as investors appear to be looking past the negative headlines and forward to a quick peak and receding of the current wave. Crude oil is modestly higher this morning ahead of the OPEC+ production decision later today. The sell-off in treasuries continues as the 10-year yield is up another three basis points to 1.66%. In the crypto space, bitcoin is up just over 1% to around $46,500. On the economic calendar today, the only major report of note is ISM Manufacturing which is forecast to pull back less than a point from last month’s reading of 61.1.
Read today’s Morning Lineup for a recap of all the major market news and events from around the world, including the latest US and international COVID trends.
Covid cases in the United States have reached record highs in recent days as the Omicron variant runs rampant around the United States and the world. Between Americans traveling less at the margin, airlines unable to fully staff flights, and winter weather canceling flights, air travel has been impacted. That should negatively impact the stocks of airlines, but in yesterday’s trading, the US Global Jets ETF (JETS) closed at its highest level since the Omicron variant first started making headlines over Thanksgiving.
In markets, it’s always a good sign when stocks stop going down on bad news, and while some of yesterday’s strength in airlines could have been tied to the drag of tax-loss selling no longer being a factor with the turn of the calendar, the fact that airlines stocks made a higher low back in mid-December and are now making a higher high is a trend to watch.

Start a two-week trial to Bespoke Premium to read today’s full Morning Lineup.