Crude Oil Snapping a Historic Winning Streak
With front-month WTI futures lower again today and in addition to the losses earlier this week, black gold declined over 2% this week. As shown below, this week’s decline looks to be breaking the commodity’s uptrend that has been in place since late last year which has brought it up to some of the highest levels in several years.
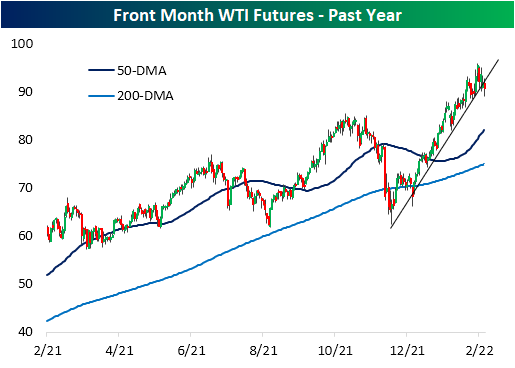
The rally over the past few months has been very consistent for crude oil. In fact, crude oil is on pace for its first weekly loss in eight weeks. Historically, it has been uncommon for crude oil to rally for such a long span. Since 1983, there have only been five other weekly winning streaks that have also gone on for at least 8 weeks in a row. The most recent of these ended at nine weeks last October.

Below we show the performance of crude oil following each time that it has ended a winning streak of at least 6 weeks, of which there have been 24 since 1983. Performance following the end of these streaks has been mixed with positive performance around 50% of the time one week, one month, six months, and one year later across these instances. Three returns, however, have more consistently seen positive returns which have on average been larger than the norm. Click here to view Bespoke’s premium membership options.

Daily Sector Snapshot — 2/18/22
The Bespoke Report – 2/18/22 – “Nobody Told Me There’d Be Days Like These”
This week’s Bespoke Report newsletter is now available for members.
For anyone whose investing experience begins with the COVID lockdowns, nobody told them there’d be days like we’ve seen in 2022 where the market not only goes down some days but goes down more often than it goes up! As the next line of the Lennon song goes, “strange days indeed.” Yoko Ono once said in an interview that the impetus for John Lennon writing “Nobody Told Me” was that he thought the world had lost its course. These days, the world probably lost its way in the early days of COVID, but the market lost its course late last year. Besides Energy this year, nothing has worked for investors. A company can have all the growth in the world, but if the earnings aren’t there good luck. Bonds, which usually provide some level of support during a market sell-off, have done just as bad as equities.
Heading into this weekend, we have to say we’re feeling a little bit of déjà vu. In last Friday’s report, we wrote that “on Friday [2/11] geopolitical concerns crowded out the FOMC and inflation when reports surfaced that a Russian attack on Ukraine was imminent” with an attack likely coming on February 16th. February 16th came and went with no attack, but markets still remain on edge regarding Ukraine. Once again this Friday, the Wall Street Journal sparked an intraday sell-off with the headline “US Warns of Imminent Russian Invasion of Ukraine With Tanks, Jets, Cyberattacks”. At some point, these headlines may be correct, but maybe, just maybe, by the time the attack actually comes, we’ll be numb to the headlines.
In this week’s Bespoke Report we cover all the major events of the week and also provided an analysis of how the current period compares to historical market corrections and bear markets. To read this week’s full Bespoke Report and access everything else Bespoke’s research platform has to offer, start a two-week trial to one of our three membership levels.


Bespoke’s Morning Lineup – 2/18/22 – Same ______, Different Friday
See what’s driving market performance around the world in today’s Morning Lineup. Bespoke’s Morning Lineup is the best way to start your trading day. Read it now by starting a two-week trial to Bespoke Premium. CLICK HERE to learn more and start your trial.
“In preparing for battle I have always found that plans are useless, but planning is indispensable.” – Dwight D. Eisenhower
It’s Friday again, and heading into the weekend, investors are preoccupied with the same issues they were last Friday, namely Russia and the Fed. While a week has passed, there still hasn’t been much more clarity on either front. Regarding the Fed, the question remains whether they will go with a 25 or 50 bps hike at the March meeting, and market expectations have actually shown a decline in expectations for a 50 bps hike down from close to 100% late last week to just about 36% now. On the Russia front, the only real differences are that the 2/16 ‘invasion date’ came and went without much activity, but now rather than having investors on edge heading into a two-day weekend, this Friday, we’re heading into a three-day weekend which only increases the level of uncertainty.
Closing out the week, the only economic indicators on the calendar are Existing Home Sales and Leading Indicators which will both be released at 10 AM. Futures, which were indicated higher have now reversed into the red on headlines that separatists in Donbas are evacuating women and children into Russia as tensions escalate.
Read today’s Morning Lineup for a recap of all the major market news and events from around the world, including the latest US and international COVID trends.
Even when futures were trading higher, it did little to improve the technical picture for the S&P 500. Besides the fact that the downtrend from the January high remains firmly in place, yesterday’s decline took SPY back below its 200-day moving average, so until that changes, bulls will have little incentive to take a stand.

Start a two-week trial to Bespoke Premium to read today’s full Morning Lineup.
The Bespoke 50 Growth Stocks — 2/17/22
The “Bespoke 50” is a basket of noteworthy growth stocks in the Russell 3,000. To make the list, a stock must have strong earnings growth prospects along with an attractive price chart based on Bespoke’s analysis. The Bespoke 50 is updated weekly on Thursday unless otherwise noted. There was one change to the list this week.
The Bespoke 50 is available with a Bespoke Premium subscription or a Bespoke Institutional subscription. You can learn more about our subscription offerings at our Membership Options page, or simply start a two-week trial at our sign-up page.

The Bespoke 50 performance chart shown does not represent actual investment results. The Bespoke 50 is updated weekly on Thursday. Performance is based on equally weighting each of the 50 stocks (2% each) and is calculated using each stock’s opening price as of Friday morning each week. Entry prices and exit prices used for stocks that are added or removed from the Bespoke 50 are based on Friday’s opening price. Any potential commissions, brokerage fees, or dividends are not included in the Bespoke 50 performance calculation, but the performance shown is net of a hypothetical annual advisory fee of 0.85%. Performance tracking for the Bespoke 50 and the Russell 3,000 total return index begins on March 5th, 2012 when the Bespoke 50 was first published. Past performance is not a guarantee of future results. The Bespoke 50 is meant to be an idea generator for investors and not a recommendation to buy or sell any specific securities. It is not personalized advice because it in no way takes into account an investor’s individual needs. As always, investors should conduct their own research when buying or selling individual securities. Click here to read our full disclosure on hypothetical performance tracking. Bespoke representatives or wealth management clients may have positions in securities discussed or mentioned in its published content.
Bespoke’s Weekly Sector Snapshot — 2/17/22
Diminishing Relative Strength For The US
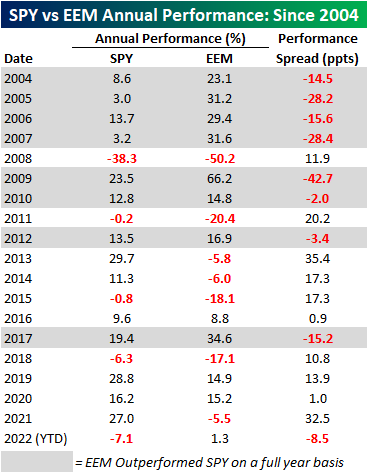
In 2021 US equities, using the S&P 500 ETF (SPY) as a proxy, outperformed emerging markets (EEM) by 32.5 percentage points (ppts). That performance spread fell just short of 2013 when the performance spread was 35.4 percentage points (ppts). After 2013, SPY also outperformed EEM for each of the following three years by an average of 11.8% (median: 17.3%). Notably, we are currently on a streak of another four consecutive years of SPY outperforming EEM, which is tied with the period from 2013 through 2016 for the longest streak on record since EEM began trading in July of 2003. So far this year, SPY has traded down by 7.1% while EEM has gained 1.3%, thus resulting in a performance spread of 8.5 ppts.
The start to 2022 has been tough for US equities relative to emerging markets, but what, if anything, does this mean for performance in the remainder of the year? Today (2/17) is the 33rd trading day of 2022, and since 2004, SPY actually only outperformed EEM at this point on a YTD basis 36.8% of the time. When EEM has outperformed SPY in the first 33 trading days of the year, the average rest of year performance spread has been -3.4 ppts (median: -5.6 ppts), meaning that EEM tends to continue outperforming for the rest of the year. While SPY tended to underperform, which one performed better for the remainder of the year was basically a coinflip as EEM only outperformed a little bit more than half of the time (54.5%). In terms of relative performance at this point in the year, 2022 ranks as one of the worst on record, second only to 2006 when SPY underperformed by 8.5 ppts. In 2006, EEM continued to outperform gaining 15.6% for the rest of the year compared to a 9.9% gain for SPY.
Since 2004, there have only been four years where SPY traded down from the close on the 33rd trading day of the year through year-end, and three of those occurrences were in years where SPY underperformed EEM in the first 33 trading days. When EEM outperforms SPY by over 4% in the first 33 trading days, the average rest of year performance for SPY has been a gain of 10.6% (median: 9.9%) and 10.0% (median: 15.6%) for EEM. Neither of these performance numbers differs all that much from the median rest of year returns in all years since 2004.

The chart below shows the relative strength of SPY vs EEM and European equities, as measured by the iShares Europe ETF (IEV) over the last six months where a rising line indicates outperformance of US stocks while a falling line indicates underperformance. Relative to both ETFs, US stocks are still outperforming over the last six months, but there was a clear shift in performance that began late in 2021, and both EEM and IEV are outperforming SPY.

Within the emerging markets group, Brazil (EWZ), South Africa (EZA), and Hong Kong (EWH) have been the strongest performers YTD, gaining 18.0%, 14.2%, and 6.0%, respectively. Of all of the countries we tracked that are classified as emerging markets, only one has underperformed the US YTD: Russia (ERUS). ERUS is down 8.2% YTD as the prospects of devastating sanctions from a potential invasion of Ukraine have been increasingly priced in. Click here to view Bespoke’s premium membership options.

Big Expectations Out of Philly
The New York Fed started off this month’s regional Fed manufacturing indices on a high note rising back into expansionary territory. While the reading is still positive, the neighboring Philly Fed’s index saw a more significant decline this month dropping 7.2 points to 16. That is only slightly above the December low of 15.4 indicating a material deceleration in activity as the index now sits in the middle of its historical range.

Breadth in this month’s report was weak with most current condition categories declining. Expectations were far worse without a single index moving higher and a couple now in the bottom few percentiles of their historical ranges. While lower, most indices remain positive, and those that are negative—Unfilled Orders and Delivery Times—are not necessarily outright negatives as they indicate expectations for alleviation of backlogs and supply chain stress.

Demand slowed in February with the New Orders index facing a 3.7 point decline with a similar decline in the expectations index. While that reading was still above the December low, the Shipments index dropped to the lowest level since August 2020. Unfilled Orders also fell by over 7 points this month, but that leaves the index at a much more elevated reading seeing as the January print was in the top 1% of all months. Expectations are in an entirely different situation, though. The expectations index plummeted 11.3 points to -18.2 which was the lowest level since July 1998. In other words, the region’s firms expect to massively catch up on existing orders in the months ahead.

One likely reason for that optimism is expectations for alleviations in supply chains. Higher readings in the Delivery Times index points to businesses reporting longer lead times. That index remains well above most readings of the past several decades, but it also has peaked and fallen to the lowest level since September. Expectations have outright collapsed to -22.3 which is the lowest reading since October 2008. This month’s decline was also the third-largest one month drop on record.Click here to view Bespoke’s premium membership options.

B.I.G. Tips – Bullish Sentiment Falling to Rock Bottom
Seasonally Unusual Uptick Drives Claims Higher
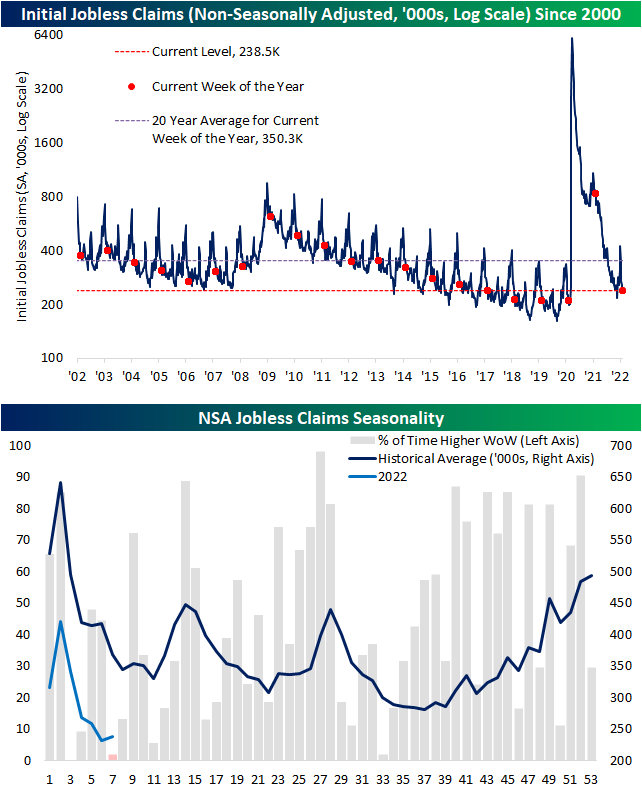
Initial jobless claims rose 23K this week to 248K after a seasonally unusual increase in claims (more on that below). That marks the largest one-week increase in the seasonally adjusted number since the week of January 14th when claims rose by 59K.

The current week of the year has historically been an impressive one for claims. In fact, going back to 1967 when claims data begins, the only year in which the current (the 7th) week of the year has seen NSA claims rise week over week was 1978. This year can be added to that list now as NSA claims rose a modest 7.8K. That seasonally unusual uptick was part of the reason for the large rise in SA claims. Although claims were higher, the current level remains healthy and within the range of pre-pandemic years.
Continuing claims are lagged an additional week to initial claims and that reading fell more than expected dropping to 1.593 million. While off the lows from the end of last year, that remains one of the strongest readings of the past several decades. Click here to view Bespoke’s premium membership options.
