Bespoke’s Morning Lineup – 3/5/21 – Stronger Than Expected Jobs Report
See what’s driving market performance around the world in today’s Morning Lineup. Bespoke’s Morning Lineup is the best way to start your trading day. Read it now by starting a two-week free trial to Bespoke Premium. CLICK HERE to learn more and start your free trial.
“You must not only learn to live with tension, you must seek it out. You must learn to thrive on stress.” – J. Paul Getty
Thankfully, it’s Friday. After another week of declines for equities, futures were modestly positive this morning, but that changed with the release of the February employment report. The bond market was already showing some signs of concern heading into the release, and those concerns look to have been warranted as the headline number came in well above forecasts (379K vs 200K). In reaction to the report, the 10-year yield has risen from a pre-release level of 1.58% to 1.62% now.
Be sure to check out today’s Morning Lineup for updates on the latest market news and events, movements in the Japanese bond market, German factory orders, an update on the latest national and international COVID trends, including our series of charts tracking vaccinations, and much more.

Normally, when the equity market comes under selling pressure bonds rally providing some level of cushion to a diversified portfolio. In the last few weeks, though, that still hasn’t been the case. The chart below is from the second page of the Morning Lineup and shows the relative strength of the S&P 500 versus the US Treasury Long Bond Future. In an environment like the last couple of weeks where stocks have been weak, you would expect the relative strength line of the S&P 500 to decline, but so far during this pullback that hasn’t been the case. Despite a 4.6% pullback in the S&P 500, its relative strength versus the Long bond Future remains near 52-week highs.

The Bespoke 50 Top Growth Stocks — 3/4/21
Every Thursday, Bespoke publishes its “Bespoke 50” list of top growth stocks in the Russell 3,000. Our “Bespoke 50” portfolio is made up of the 50 stocks that fit a proprietary growth screen that we created a number of years ago. Since inception in early 2012, the “Bespoke 50” is up 437.7% excluding dividends, commissions, or fees. Over the same period, the S&P 500 is up in price by 173.5%. Always remember, though, that past performance is no guarantee of future returns. To view our “Bespoke 50” list of top growth stocks, please start a two-week free trial to either Bespoke Premium or Bespoke Institutional.

Bespoke’s Weekly Sector Snapshot — 3/4/21
B.I.G. Tips – Nasdaq 10%+ Corrections Since the Financial Crisis
Declines Keep Sentiment in Check
The drift lower in equity prices over the past couple of weeks has resulted in bullish sentiment to similarly turn lower. The AAII’s weekly reading on bullish sentiment fell for the second week in a row this week as only 40.3% of respondents reported as optimistic. That is the lowest level since only the first week of February as sentiment remains above the historical average of 38%.
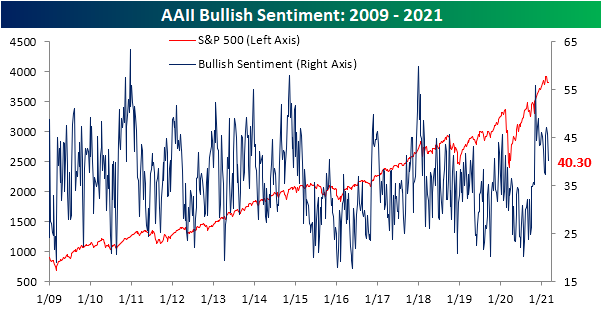
Just over a quarter of respondents reported a pessimistic outlook this week. That was up 1.5 percentage points from the previous week and the first increase in bearish sentiment in four weeks. Compared to the 5.6 percentage point decline in bullish sentiment (the largest since an 11.49 percentage point drop in November) the move in bearish sentiment was relatively small. In fact, even after the increase, outside of last week, every reading so far in 2021 has been higher than the current reading.

The decline in bullish sentiment drove the bull-bear spread to fall down to 15. That is only the lowest level since the first week of February as overall sentiment remains largely in favor of bulls, albeit less so than earlier this year.

Rather than the bearish camp, those losses to bullish sentiment went to neutral sentiment. 34.4% reported neutral sentiment this week, up 4.1 percentage points from last week. That is the biggest one-week increase and the highest level in neutral sentiment since the week of December 24th

As for the Investors Intelligence survey of newsletter writers, the same sort of moderation in optimism was evident. 53.9% of respondents to this survey reported as bullish this week while bearish sentiment saw a 0.1 point increase to 18.6%; those respectively made for the lowest and highest readings since the first half of November. While that means sentiment still favors bulls, a higher share of respondents are anticipating a correction. That reading rose to 27.5% this week, the highest level since the 29.1% reading for the week of September 23rd which was towards the tail end of a roughly 10% correction for the S&P 500. Click here to view Bespoke’s premium membership options for our best research available.

Chart of the Day: Repo Back In The Spotlight
Claims Coming In After the Storm
In addition to a higher revision of last week’s number (up 6K to 736K), initial jobless claims were higher this week moving up to 745K. While claims didn’t improve, they did come in 5K better than expectations and they remain around some of the lowest levels since November.

Unadjusted claims were also higher rising 31.5K to 748.1K. Again, in spite of that increase, claims are still at some of their best levels since the fall. Additionally, the current week of the year has normally experienced an uptick week over week. Going back through the history of the data, 72% of the time the current week of the year has seen a WoW uptick in claims.
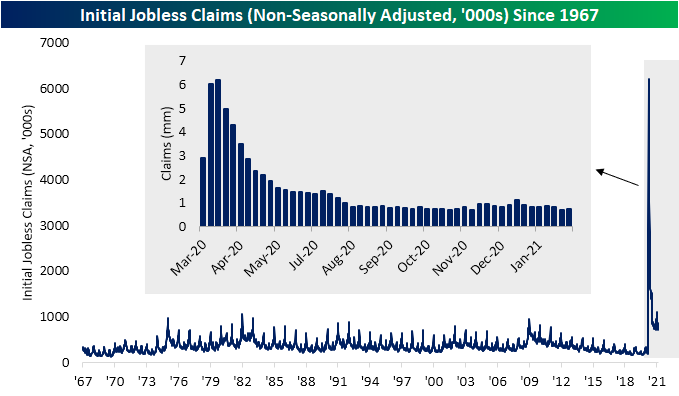
Claims from the Pandemic Unemployment Assistance (PUA) program also saw a slight uptick this week rising from 427.45K to 436.7K. The increases in regular state claims and PUA claims means total initial claims for the most recent week rose to 1.18 million from 1.14 million the prior week.
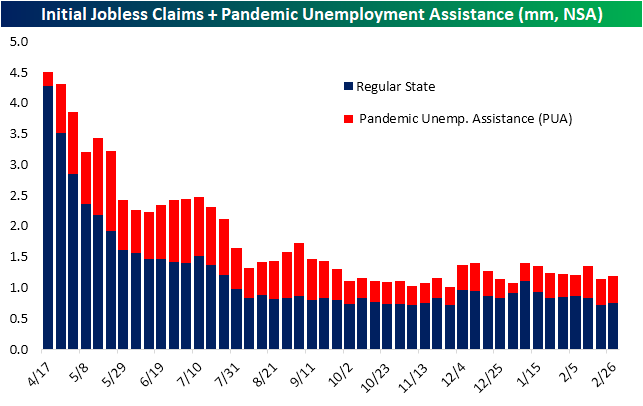
In the past few weeks, we have noted how state-level claims have seen some interesting quirks like very high readings out of Ohio. Again this week, Ohio was the single largest contributor to the level of national regular state claims followed by California, Illinois, New York, and Texas. Of these states, Texas also saw the largest week-over-week increase in regular state claims potentially as an after-effect of the winter storms in the region. That is after the state actually reported lower claims last week in the immediate aftermath of the storm. Although the Lone Star state saw a big increase in regular state claims, PUA claims saw a less significant uptick. Once again, Ohio saw a much more significant uptick by this measure.

While initial claims have not seen much of an improvement, the decline keeps on coming for continuing claims. This reading for the week of February 19th fell to a new pandemic low of 4.295 million; down 124K from the previous week.
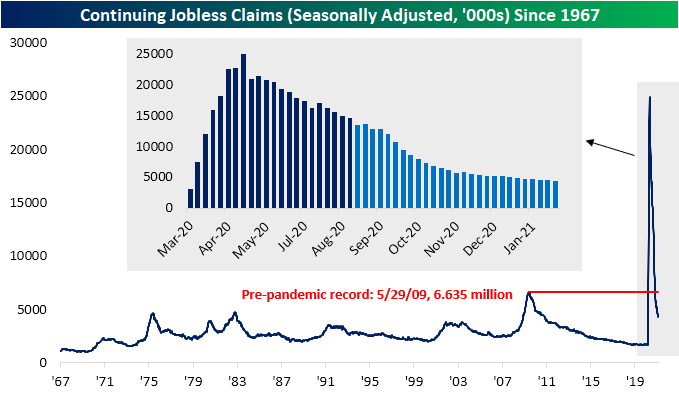
Tacking on all other assistance programs delays the data one more week. For the week of February 12th, continuing claims across all programs were lower at 18.061 million. That is the strongest reading since the week of January 15th when total claims had fallen to 17.873 million. The lower reading in total claims was a result of declines across almost all programs with the biggest decline coming from Pandemic Emergency Unemployment Compensation (PEUC) claims which fell by just over 600K. Click here to view Bespoke’s premium membership options for our best research available.


Treasuries Not Dancing To A Surging Inflation Tune
We’ve seen a lot of commentary suggesting that the recent increase in Treasury yields is being driven by a surge in fears over inflation. While it’s true that worries over inflation should drive bond prices down (higher yields), this recent episode isn’t consistent with that dynamic. In the chart below we show the change in the various segments of the UST curve since the end of October, in basis points. Higher readings indicate steepening, where a longer-term yield rises faster than a shorter-term bond yield. Generally speaking, Treasuries should steepen during inflationary episodes, with longer-term yields (more vulnerable to inflation) rising faster than shorter-term yields (more vulnerable to policy rate changes).
In the chart below we break the UST curve into 4 segments, each of which represents a certain kind of risk premium. Very short-term curvature is dictated by the Fed. As shown, the 3m2y curve has barely moved, because markets generally see the risk of near-term Fed hikes as little-changed over the last four months. The 2y5y curve is similarly tied to Fed policy action, but is much more speculative. As shown, this is where the biggest increase in yields has come. Effectively, the market sees the Fed as much more aggressive in its tightening once it lifts off. The next segment is the 5-10 year curve, which is a mixture of risk premium for Fed policy, growth, and inflation. The 5s10s curve has seen rapid steepening, but the long end of the curve (10s30s), which is most sensitive to inflation, hasn’t budged. If inflation concerns were surging, 10s30s would not be stable over the last few months.
We’ve also included on the chart market pricing for inflation over the five years starting five years from today. While we discourage investors reading too much into this metric as a forecast, it does represent a risk premium for inflation. As shown, this metric for inflation pricing has dropped considerably as yields have risen.

What to make of all this? In our view, the narrative that markets are worried about inflation is inconsistent with Treasury market movements in recent weeks. Instead, we see a market that is pricing in a much tighter Fed once interest rates do start to rise. Whether that will prove true or not is an open question, but what we can say is that inflation expectations are unlikely to be driving bond selling given where changes in yield are taking place on the curve and the performance of inflation pricing over the last few weeks. Interested in fixed income and macro analysis like this post? Click here to start a free trial of Bespoke Institutional to get immediate access to our nightly Closer and Fixed Income Weekly which focus on these markets.
Bespoke’s Morning Lineup – 3/4/21 – One Step Forward, Two Steps Back
See what’s driving market performance around the world in today’s Morning Lineup. Bespoke’s Morning Lineup is the best way to start your trading day. Read it now by starting a two-week free trial to Bespoke Premium. CLICK HERE to learn more and start your free trial.
“The reasonable man adapts himself to the world; the unreasonable one persists in trying to adapt the world to himself.” – George Bernard Shaw
After a strong start to March, major US equity indices have given up all or most of those gains in the last two days. Based on where futures are trading now, today may mark a third step backward for the equity market, although not to the same degree as the last two days. Treasury yields, which have been the tail wagging the market lately, are lower this morning with the 10-year US Treasury yield trading right around 1.45%. The economic calendar is jammed packed with Non-Farm Productivity (weaker than expected), Unit Labor Costs (weaker than expected), and Jobless Claims (in line with forecasts) just crossing. Then at 10 AM, we’ll get Durable Goods and Factory Orders at 10 AM. Fed Chair Powell will also be speaking just after noon.
Be sure to check out today’s Morning Lineup for updates on the latest market news and events, some earnings reports from the US and around the world, an update on Eurozone labor markets, an update on the latest national and international COVID trends, including our series of charts tracking vaccinations, and much more.
The Technology sector closed below its 50-day moving average again yesterday, and while many tech stocks have been getting slammed of late, the sector is down less than 7% from its closing high in February. The chart of the sector lately looks a bit ominous though. If you squint enough, you can see what looks like a head and shoulders pattern forming over the last several weeks with the neckline also coinciding with the highs from early September. If that breaks, this March, which came in like a bull (briefly), would likely be filled with more bear.

The Energy sector has been a completely different story. The sector remains right near 52-week highs after recently breaking above resistance from its June post-COVID high.
Given the diverging paths of the two sectors, the performance spread between the two sectors over the last six months now stands at 35.3 percentage points, which is the widest margin of underperformance for the Technology sector relative to Energy in nearly 20 years!

Given the diverging paths of the two sectors, the performance spread between the two sectors over the last six months now stands at 35.3 percentage points, which is the widest margin of underperformance for the Technology sector relative to Energy in nearly 20 years!
