Bespoke’s Morning Lineup – 3/23/22 – More Fed Speak
See what’s driving market performance around the world in today’s Morning Lineup. Bespoke’s Morning Lineup is the best way to start your trading day. Read it now by starting a two-week trial to Bespoke Premium. CLICK HERE to learn more and start your trial.
“Don’t be afraid to give up the good to go for the great.” – John D. Rockefeller
After Jerome Powell hinted at the possibility of the FOMC hiking rates by 50 bps earlier this week, Cleveland Fed President Loretta Mester became the latest Fed official to throw their hat in the ring in support of a 50 bps hike when she said that she would “find it appealing to front-load some of the needed increases earlier rather than later”. Mester is only the first of a number of Fed officials scheduled to speak today with a roster that includes Powell at 8 AM, Daly at 11:45 AM, and Bullard at 3 PM (all times eastern).
Futures are lower this morning as the Nasdaq leads the declines. There’s been no major news regarding the war in Ukraine. President Biden will be traveling to a NATO summit where the US and EU are expected to issue additional sanctions against Russia, and the White House National Security Advisor warned that the war is not going to be easy or quick. Crude oil and gold are basically flat on the morning, while bitcoin is modestly lower as it continues to trade in what has been a relatively narrow range. Volatility in nickel continues, though, with the metal rallying 15% as that market attempts to find equilibrium.
On the economic calendar, mortgage applications fell more than 8% w/w, and the only other report on the calendar for today is New Home Sales at 10 AM. That report is expected to show an increase of about 1.5% to 814K versus January’s reading of 801K and would be down just under 3% versus last year’s level.
Read today’s Morning Lineup for a recap of all the major market news and events from around the world, including the latest US and international COVID trends.
We have really seen some monumental moves in financial markets over the last few weeks. Since we’re talking about the Federal Reserve, the latest example includes the S&P 500’s performance in the week since last week’s hike. From the close last Tuesday before the Wednesday FOMC announcement, the S&P 500 has rallied 5.85%. Going back to 1994 when the FOMC first started announcing its policy decisions on the day of the meetings, the S&P 500’s performance in the five trading days from the close on the day before last week’s announcement has been stronger than comparable time periods following any other rate hike. Heading into this hike, the S&P 500 was trading down further from its 52-week high than nearly every other rate hike since 1994, so the performance over the last week has helped the market to dig itself out of the hole.
The chart below shows the five-day performance of the S&P 500 following every prior rate hike announcement since 1994. Overall, the average five-day return of the S&P 500 following the 41 rate hike announcements has been a decline of 0.08% with positive returns less than half of the time (44%). The current period is easily the strongest on record, and the only two other periods where the S&P 500’s performance was even close were in March 2000 and before that June 1999. Granted, the S&P 500 was down sharply ahead of this hike, but any time March 2000 is the closest comparison you can find, that’s a comparison bulls don’t want to see.

Start a two-week trial to Bespoke Premium to read today’s full Morning Lineup.
Best Performers Since 3/14 Pivot
Early last week, the US equity market pivoted, gaining 1%+ for four consecutive days between last Tuesday and last Friday (3/15-3/18). Sentiment has shifted amongst the investing community for the time being. For now, it seems that the market may have largely priced in some of the most hawkish Fed tightening scenarios. Remember, we already saw huge drops of 50%, 60%, 70%, even 80%+ in many of the most interest-rate sensitive growth stocks before the Fed even lifted off of 0%. How much further were investors expecting them to go?
Since the 3/14 pivot, certain members of the S&P 1500 have already gained over 20%, but still remain well off of 52-week highs. Of the top 35 performers since last Monday, the average stock is still 43.4% off of its 52-week highs (median: 47.1%). Although there is much recovery room left for many of these high-flyers, this is a move in the right direction. The top performing stock since the 3/14 close is GameStop (GME), which has moved 58.0% higher on the back of a 30.9% move today. This may imply that investors have increased their risk appetite, or that retail investors viewed the dip as a buying opportunity, which would likely apply to the broader market from a retail perspective. Selectquote (SLQT) and Nektar Therapeutics (NKTR) rank immediately below GME, gaining 53.7% and 45.9% respectively. Both of these stocks are operating at a loss on the bottom line, which tells us that the risk-on trade has performed strongly over the last week. Other noteworthy names on the list include Tesla (TSLA), Avis Budget (CAR), Etsy (ETSY), NVIDIA (NVDA) and PayPal (PYPL).
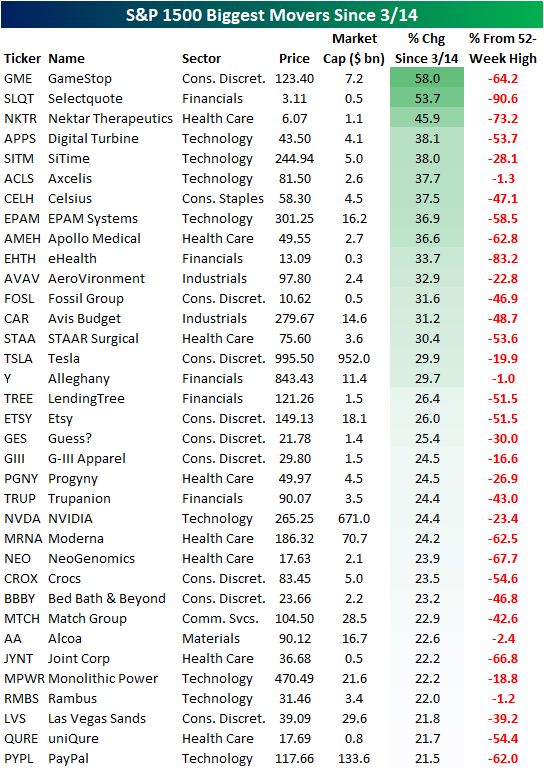
Breaking this down further, the sectors that help up strongly in the face of a downturn earlier this year have performed the worst since the 3/14 pivot. Utilities and Energy members of the S&P 1500 have only gained 0.6% and 2.6% on average, respectively, since last Monday. On the other hand, Consumer Discretionary, Health Care, and Technology members of the S&P 1500 have gained 7.8%, 8.1% and 10.6% on average, respectively. Based on the data below, the sectors most off their highs have rallied the most aggressively since the pivot, while the sector leaders from pre-3/14 have lagged. Click here to try out Bespoke’s premium research service.

None of the information in this report or any opinions expressed constitutes a solicitation of the purchase or sale of any securities or commodities. This is not personalized advice. Investors should do their own research and/or work with an investment professional when making portfolio decisions. Past performance of any investment is not a guarantee of future results. Bespoke representatives or clients may have positions in securities discussed or mentioned in its published content.
Housing Affordability Slides Out of Reach
After a massive surge in housing prices during the pandemic and recovery, the sticker price of housing has soared. Now, with the Federal Reserve starting to raise interest rates and bond markets creaking under the stress, mortgage rates are up to 4.5% and are nearing the highest levels in over a decade. The result is that the cost of occupying a home (that is, monthly payment needed to cover the cost of a house) has soared. As shown in the chart below, the mortgage payment required to cover the median existing home price at the national average mortgage rate is up nearly 30% over the past year, the fastest advance since at least 1987.

Of course, affordability is also a function of income. If wages are rising rapidly, higher mortgage rates and home prices might be offset by more income to cover those payments. To account for this, we convert the monthly payment implied by the median existing home price and the national average mortgage rate into hours, dividing it by the average hourly earnings of non-managerial workers. As shown in the chart below, at the average hourly wage today, a worker would have to work 51.1 hours to cover a monthly mortgage payment. That’s the highest since August of 2008, and shows that the combination of higher home prices and mortgage rates mean that housing is increasingly outpacing incomes. Of course, with supply still tight, demand could fall quite a bit without a big hit to home prices. But the housing market is getting harder and harder to buy in to for most Americans. That also doesn’t include the fact that down payments are rising rapidly. The median existing home required 2,756 hours worth of average hourly earnings assuming 20% down in February; that’s only been surpassed by the blow-off top for home prices in the mid-2000s. Assuming 5% down, which many first-time buyers are eligible for, the numbers look less scary with 689 hours worth of wages needed. But that’s still rising rapidly. Bottom line: housing prices are rapidly outpacing incomes and that will suppress demand, even if it might not be enough to make up for record low inventories. This analysis was first published last Friday in The Bespoke Report, Bespoke’s weekly newsletter. To receive The Bespoke Report and all of Bespoke’s other reports covering sentiment and positioning, sign up for a two-week trial today.

Daily Sector Snapshot — 3/22/22
Chart of the Day: S&P 500 (SPY) Slings Ahead While Treasuries (TLT) Tumble
Richmond Rebounds Sans Expectations
So far this month, regional Federal Reserve District readings on manufacturing have been mixed with a stronger than expected reading out of Philadelphia and a much weaker than expected reading out of New York. Today’s release of the Richmond Fed’s index saw the composite reading rise by 12 points to 13 rather than the modest single-point increase that was expected.

The one-month swing in the composite index was on the large side relative to the report’s history. The 12 point month over month gain ranks in the 90th percentile of all monthly moves bringing the index from the low end of its historical range (35th percentile) to the upper end (79th percentile). Given the large increase, breadth in this month’s report was strong across categories with a majority of categories seeing significant month over month increases. Expectations, however, were generally more dour.

Quantifying just how wide of a difference there was in the changes of current conditions and expectations, in the chart below, we show the average spread across each categories month over month change in the current conditions versus expectations indices. In other words, more positive readings would mean current conditions are rising much more rapidly than expectations and vice versa for more deeply negative readings. This month’s reading was the second-highest reading on record outside of March 2020. In other words, this month’s report saw a historic disconnect between the moves in readings on the present situation versus the future outlook.

Whereas the February report saw new orders contract alongside order backlogs and shipments, this month, each index saw a sizeable rebound. New orders grew at a healthy rate as the index rose to 10 and the shipments index is now in a similar area of its historical range after an even larger monthly increase. In fact, one month after one of the largest monthly declines on record for the index, this month’s 20 point gain came up just short of a top 5% monthly increase. Given the strength in new orders, order backlogs also rose while supply chain stress showed further signs of easing as the vendor lead times index fell to 41. While still above December’s low, it marks a significant improvement from October’s high of 67.
Although there were broad improvements in the current condition indices for these categories, expectations were far weaker. The expectation indices for New Orders, Shipments, and Order Backlogs experienced declines ranking in the bottom few percent of all month-over-month changes on record. Similarly, vendor lead times saw a top decile month-over-month gain. In other words, Richmond area manufacturers do not appear to expect the improvement in conditions to carry through over the next several months.

Likely as a result of the abating number of COVID cases, employment metrics improved in March. Firms reported taking on more workers and raising wages at a higher rate. Meanwhile, the length of the average workweek saw a huge 19 point rebound back into positive territory. Firms also reported it was harder to find workers with necessary skills, though, that reading remains significantly improved from record lows set a little under one year ago. We would also note, while demand metrics saw big declines and much weaker levels of expectations indices, expectations indices for employment categories continue to sit at much more historically elevated levels even in spite of some modest declines in March.

Manufacturers continue to report massive price increases relative to other periods in the survey’s history. Prices paid were reported to have risen at an 11.05% annualized rate and prices received rose at a 9.16% clip. While elevated, both readings are still off their January peaks.Click here to view Bespoke’s premium membership options.

Bespoke Stock Scores — 3/22/22
Bespoke’s Morning Lineup – 3/22/22 – At the End of the Day…
See what’s driving market performance around the world in today’s Morning Lineup. Bespoke’s Morning Lineup is the best way to start your trading day. Read it now by starting a two-week trial to Bespoke Premium. CLICK HERE to learn more and start your trial.
“Patience and fortitude conquer all things.” – Ralph Waldo Emerson
Treasuries have continued to sell-off this morning following yesterday’s trouncing in the wake of Powell’s comments regarding the potential for a 50 bps rate hike at upcoming FOMC meetings. Equities, on the other hand, have seemingly ignored the higher rates and traded higher. In the commodity space, crude oil and gold are both essentially flat.
In the Russia-Ukraine war, talks for a potential ceasefire have seemingly stalled as the Russians argue that Ukraine is dragging its heels, while Ukraine asserts that it will not cede any land to Russia. Zelensky has now even asked the pope to step in and mediate. As the talks stall, Russia hasn’t let up with its military strikes even after reports suggest that its ground game has been faltering.
Read today’s Morning Lineup for a recap of all the major market news and events from around the world, including the latest US and international COVID trends.
The last week of trading has really seen some extraordinarily strong finishes for the market. The chart below shows the S&P 500’s performance in the last hour of trading so far in 2022. For much of January and through February, the majority of days saw the equity market sell-off into the close. In fact, at one point in late January, the performance of the S&P 500 in the final hour of trading was the weakest since October 1987. Over the last five trading days, though, in the middle of a war in Europe where you would think concerns of overnight headline risk would be at their highest, we have seen five straight days where the S&P 500 has gained at least 0.33% in the last hour of trading. It may not be uncommon to see one or two days of similar gains in the last hour of trading, but to see five straight is extremely rare. In fact, to find the last time this happened, you have to go all the way back to July 2002! Talk about finishing off on a high note!

Start a two-week trial to Bespoke Premium to read today’s full Morning Lineup.
Daily Sector Snapshot — 3/21/22
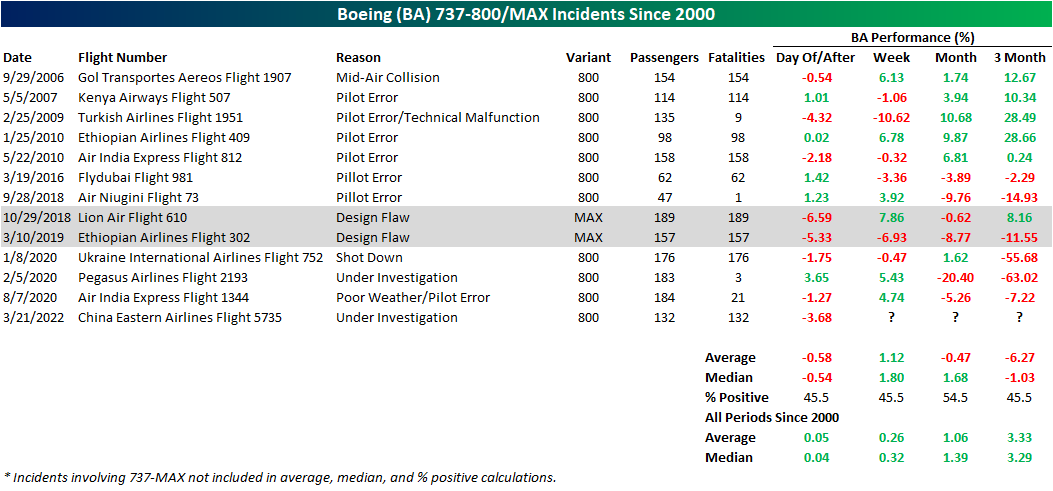
Boeing (BA) and 737 Crashes
Shares of Boeing (BA) are down nearly 4% in today’s session as of this writing on news of a fatal crash of one of the company’s 737 jets in China. Any plane crash which results in fatalities is obviously a tragedy, and our hearts go out to all the victims and their families. While it’s hard to pivot to the market-related implications of these types of events, investors in Boeing and related companies are obviously interested in how these types of events, whether due to mechanical or other issues, will impact their investments. Today’s crash involved one of the company’s 737-800 planes and not the 737-MAX (the variant which was involved in crashes in 2018 and 2019). At this point, there are no details regarding the cause of the crash, but details will likely be forthcoming in the days and weeks ahead.
In the chart below, we show the chart of BA since the start of 2000 and include red dots indicating each time that there has been a fatal incident involving a 737 (any generation of the plane). There have been a total of three dozen incidents internationally prior to today, and historically, these past events have not had any consistent impact on the performance of BA stock.

That being said, the immediate reaction in today’s session is set to rank pretty high up on the list of worst declines after a crash involving a 737. Below we show the daily percent change of BA in the first session after a 737 variant had a fatal incident. As might be expected, the 737-MAX crashes in 2018 and 2019 were the two worst single-day declines for the stock of these instances with drops of 6.59% and 5.33%, respectively. The Turkish Airlines Flight 1951 crash in 2009 ranks as the next largest drop of 4.32%. In general, since the 737 MAX issues surfaced, on news of any fatal incident involving 737s, investors have been quick to sell first and ask questions later.

The 737 Next Generation (abbreviated 737NG) which includes the 737-600, 700, 800, and 900 variants is the generation that Boeing produced from 1996 and ceased assembly of in 2019 as the company’s production switched to the 737 MAX. Of the 737NG generation, the 800 variant (the variant involved in today’s crash) is the most common. Given this, in the table below, we show those fatal incidents involving the 800 series since 2000 as well as the two MAX crashes given their importance in recent years. This was the seventh fatal incident involving this plane without any survivors.
Boeing’s stock has mostly seen a negative reaction in response to these incidents and even though the next week has typically seen the stock rebound, performance over the next one and three months, especially since the issues with the MAX began, have tended to be followed by declines. Of course, each of these incidents has a fair degree of nuance to each one. For example, there are numerous reasons as to why these crashes occurred, and the majority had nothing to do with an inherent flaw in the BA aircraft. Whereas the 737-MAX problems were accredited to a design flaw, and thus are more directly negative for Boeing, many of the other incidents were on account of the flight crew or pilot error. Additionally, there is also the issue of poor timing like the early 2020 instances which lined up with the COVID crash. In other words, the weak performance following these crashes had more to do with factors outside of the crashes themselves. Again, any crash, whatever the cause, is a tragedy, but from a market perspective, it’s important to differentiate between the cause behind them. Click here to view Bespoke’s premium membership options.