Big Expectations Out of Philly
The New York Fed started off this month’s regional Fed manufacturing indices on a high note rising back into expansionary territory. While the reading is still positive, the neighboring Philly Fed’s index saw a more significant decline this month dropping 7.2 points to 16. That is only slightly above the December low of 15.4 indicating a material deceleration in activity as the index now sits in the middle of its historical range.

Breadth in this month’s report was weak with most current condition categories declining. Expectations were far worse without a single index moving higher and a couple now in the bottom few percentiles of their historical ranges. While lower, most indices remain positive, and those that are negative—Unfilled Orders and Delivery Times—are not necessarily outright negatives as they indicate expectations for alleviation of backlogs and supply chain stress.

Demand slowed in February with the New Orders index facing a 3.7 point decline with a similar decline in the expectations index. While that reading was still above the December low, the Shipments index dropped to the lowest level since August 2020. Unfilled Orders also fell by over 7 points this month, but that leaves the index at a much more elevated reading seeing as the January print was in the top 1% of all months. Expectations are in an entirely different situation, though. The expectations index plummeted 11.3 points to -18.2 which was the lowest level since July 1998. In other words, the region’s firms expect to massively catch up on existing orders in the months ahead.

One likely reason for that optimism is expectations for alleviations in supply chains. Higher readings in the Delivery Times index points to businesses reporting longer lead times. That index remains well above most readings of the past several decades, but it also has peaked and fallen to the lowest level since September. Expectations have outright collapsed to -22.3 which is the lowest reading since October 2008. This month’s decline was also the third-largest one month drop on record.Click here to view Bespoke’s premium membership options.

B.I.G. Tips – Bullish Sentiment Falling to Rock Bottom
Seasonally Unusual Uptick Drives Claims Higher
Initial jobless claims rose 23K this week to 248K after a seasonally unusual increase in claims (more on that below). That marks the largest one-week increase in the seasonally adjusted number since the week of January 14th when claims rose by 59K.

The current week of the year has historically been an impressive one for claims. In fact, going back to 1967 when claims data begins, the only year in which the current (the 7th) week of the year has seen NSA claims rise week over week was 1978. This year can be added to that list now as NSA claims rose a modest 7.8K. That seasonally unusual uptick was part of the reason for the large rise in SA claims. Although claims were higher, the current level remains healthy and within the range of pre-pandemic years.
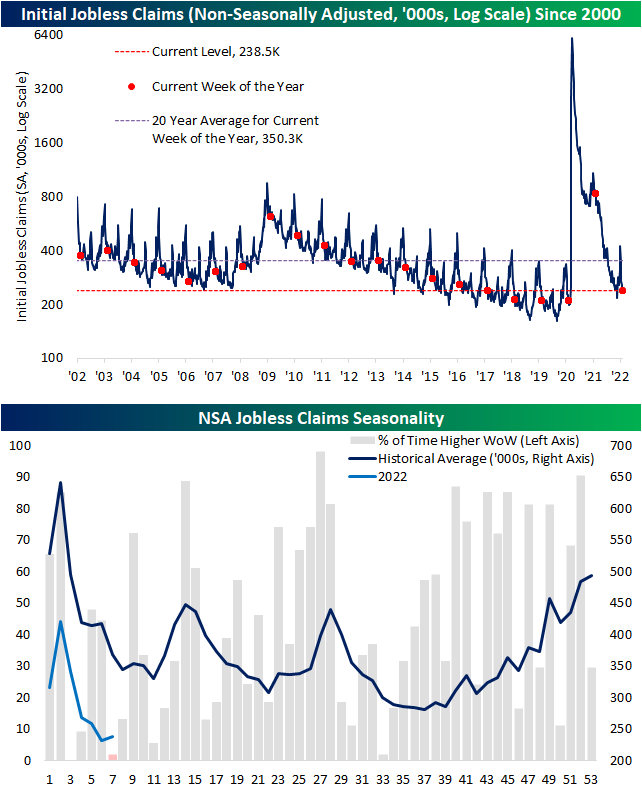
Continuing claims are lagged an additional week to initial claims and that reading fell more than expected dropping to 1.593 million. While off the lows from the end of last year, that remains one of the strongest readings of the past several decades. Click here to view Bespoke’s premium membership options.

Chart of the Day: Short Rate Shocks
Mixed Housing Reports
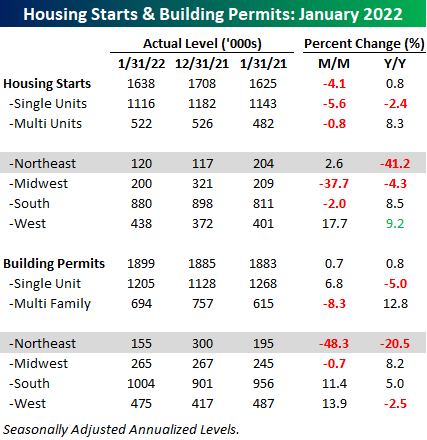
Today’s report on Building Permits and Housing Starts from the US Census came in mixed relative to expectations and last month’s readings. Versus expectations, Housing Starts were weaker while Building Permits unexpectedly rose. As shown in the table below, the weakness in Housing Starts this month continued to come from single-family units which have faced delays due to shortages of materials and labor. On a regional basis, the Northeast was notably weak with the year/year reading falling more than 41%. Unlike Housing Starts, Building Permits showed strength among single-family units, rising 6.8% despite still being down 5% y/y. Multi-family units, on the other hand, saw the complete opposite pattern play out as the m/m reading dropped 8.3% while the y/y reading was still up over 12%. On a regional basis, the Northeast was once again the weakest area of the country as the m/m reading dropped nearly 50% while the y/y reading dropped just over 20%.
Trends in housing starts have been a great leading indicator of the economic cycle over the years as the 12-month average of total Housing Starts tends to peak and roll over well in advance of a recession. Updating the chart with January’s levels, the 12-month average made another cycle high in January, but the rate of increase is starting to flatten out. For example, this month’s increase in the 12-month average was the smallest m/m increase since February 2021. It’s still far from rolling over, but momentum in housing has clearly slowed.

While actual starts may not be rolling over, homebuilder stocks have already done so. After stalling out in the mid to high eighties three times in late 2021, the sector has seen a sharp pullback in 2022. With interest rates rising and lack of adequate materials and labor to meet demand, it’s no mystery what is driving the weakness in the sector. Current levels look like an interesting juncture for the group, though, as XHB has been hanging around right around $70 for the last few weeks. That is also a level that acted as support multiple times in the second half of last year. As long as these levels hold, the technical picture for the group does not raise any red flags, but should this support level break down, it could start the beginning of a new leg lower for the group. Click here to view Bespoke’s premium membership options and sign up for a trial.

Bespoke’s Morning Lineup – 2/17/22 – Snap Out of It!
See what’s driving market performance around the world in today’s Morning Lineup. Bespoke’s Morning Lineup is the best way to start your trading day. Read it now by starting a two-week trial to Bespoke Premium. CLICK HERE to learn more and start your trial.
“If you have more than 120 or 130 IQ points, you can afford to give the rest away. You don’t need extraordinary intelligence to succeed as an investor.” – Warren Buffett
Futures are in the red again this morning but just modestly, and while they’re off their lows of the overnight session, they’ve just recently started heading lower again. Russia continues to take up a lot of the headlines, but unfortunately, there’s little in the way of resolution on the horizon. Just released headlines quoting US officials suggest that Russia is moving towards an imminent invasion, and US Secretary of State Anthony Blinken will head to the UN today to address the Security Council. No one besides Putin really knows when and how the situation will resolve itself.
Earnings season came to an ‘unoffical’ close today with Walmart’s (WMT) better than expected report, and given the multiple tape bombs that were dropped throughout the reporting period, investors will be happy to see this earnings season wind down. It was a busy morning for economic data as well, and while most of this week’s data has been better than expected, this morning’s results were mixed. To hear out instant take on all of the reports listen to it here.
Read today’s Morning Lineup for a recap of all the major market news and events from around the world, including the latest US and international COVID trends.
We’ll discuss it in more detail later today, but after seeing the latest investor sentiment readings from the American Association of Individual Investors (AAII), we couldn’t not mention them. As of the latest survey, bullish sentiment dropped from an already low reading below 25% to less than 20% this week. As shown in the chart below, the only other times that bullish sentiment was as low as it is now were in January and May 2016. Just about every survey of sentiment these days, whether it covers the economy or financial markets, shows elevated levels of pessimism. We realize there’s no shortage of concerns out there and you can take your pick as to which one is the biggest problem, but one has to ask whether these levels of pessimism are starting to get a bit extreme.

Start a two-week trial to Bespoke Premium to read today’s full Morning Lineup.
Daily Sector Snapshot — 2/16/22
Bespoke Baskets Update — February 2022
Homebuilder Sentiment and Stocks Rangebound
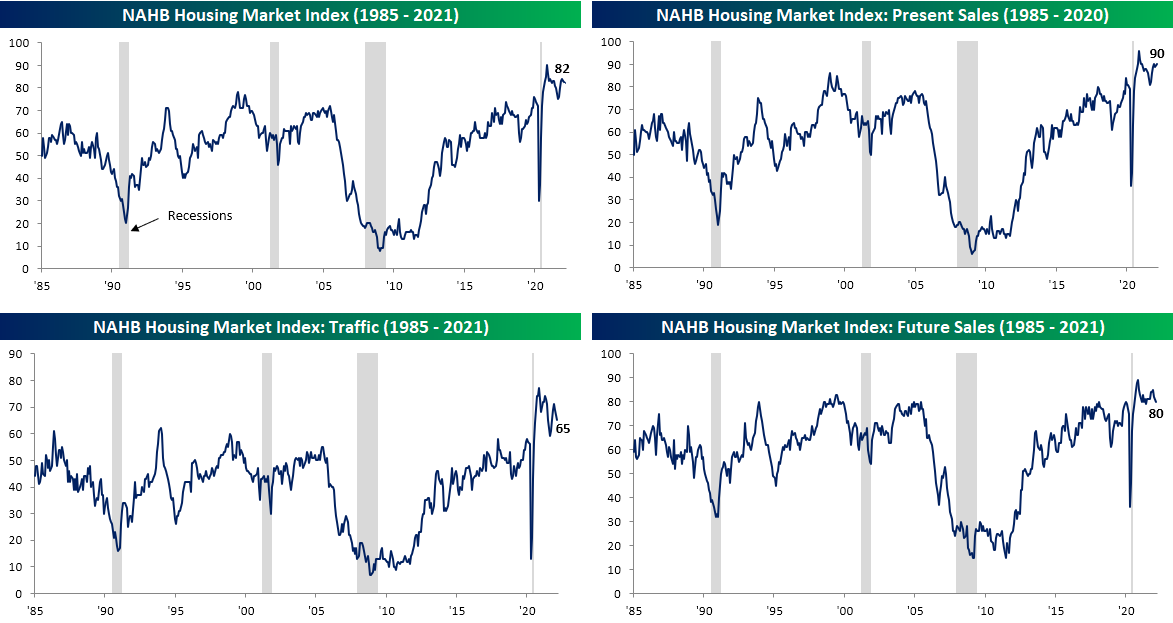
It was a busy morning of economic data, and included on the list was homebuilder sentiment from the NAHB monthly survey. After surging in the first year of the pandemic, the past year has seen homebuilder sentiment moderate until last summer when it made a short-term low at 75 (still a historically elevated reading), and for most of the time since then sentiment has rebounded. The first two months of 2022 have seen further moderation though with the February reading of 82 marking the second month in a row with a one-point decline. While sentiment is no longer improving, though, it remains well above any pre-pandemic reading.
Taking a closer look at the components of the survey, traffic and future sales have been the more pessimistic readings having continually ground lower in the past year. Present sales, however, have held up relatively well. This month even saw that index rise to 90 which tied the December reading for the strongest level since last Febraury.
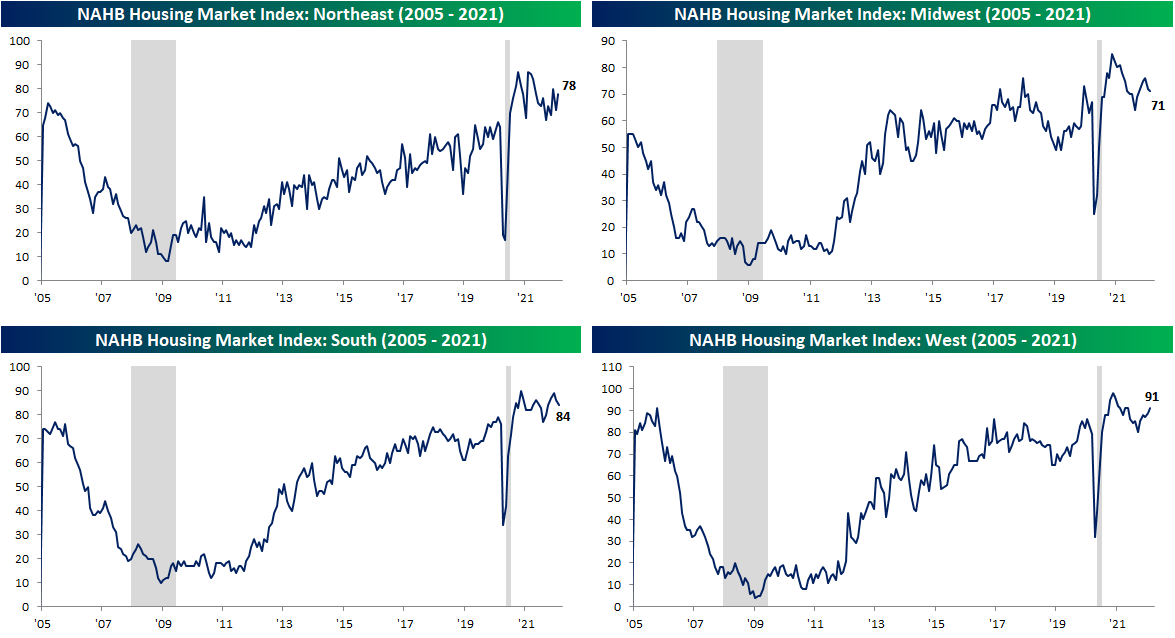
As for a geographic breakdown, pretty much each region has fallen back into the middle of the range of post-pandemic readings. In February, the Northeast saw the most substantial improvement rising 7 points to 78. That is an upper decile reading in terms of both its level and month-over-month change. The West was the only other region to improve in February, and that is in the context of what has now been several months of consistent improvements.
Like sentiment, homebuilder stocks have come off their highs. The iShares Home Construction ETF (ITB) made a double top in December, which was followed by a break below its 50-DMA and 200-DMA in the new year. For the past few weeks, ITB has been consolidating between overhead resistance at the 200-DMA and support at the lows from this past July and October. If those lows don’t hold, though, there isn’t much more support further below. Click here to view Bespoke’s premium membership options.
