B.I.G. Tips – A Positive Consumer Development
B.I.G. Tips – S&P 500 Reaches Correction
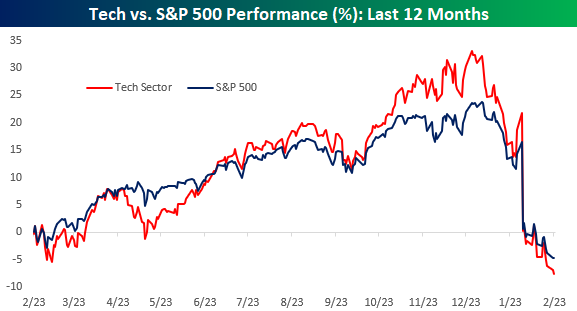
Tech’s About Face
It has been quite a tumultuous four months for the Technology sector. The chart below shows the cumulative performance of the S&P 500 and the Technology sector over the last year. From late February through early October, the performance of the two were basically in line with each other, but beginning in October, tech took off while the rally in the S&P 500 was much more muted. At one point in December, the performance spread between tech and the S&P 500 from 2/23/21 widened out to just under ten percentage points. In the span of just about two months, though, that entire spread has evaporated and the S&P 500 is actually outperforming tech over the last year. Maximum bullishness in technology came late last year, but as tech has hit the skids this year, investor sentiment is starting to follow suit.
Another way to look at the recent performance disparity is to compare the 50-day performance spread between the S&P 500 Technology sector and the S&P 500. In the chart below, we show the 50-day spread going back to 2010 where negative readings indicate tech underperformance while positive readings indicate outperformance. Just today, tech’s underperformance over the last 50 trading days dropped down below 5 percentage points which is the widest degree of underperformance over a 50-trading day span since last May. Going back to 2010, though, there have only been a handful of other periods where the spread reached as negative levels as it is now.
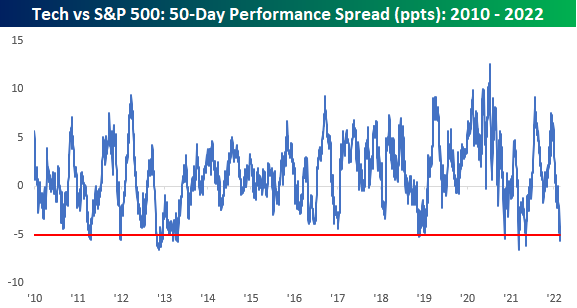
Looking at the above chart, periods like the last 50 trading days where tech underperformed by such a wide margin appear uncommon, but taking a wider angle view shows that it hasn’t always been this way. The chart below is the same one as the above but goes all the way back to 1990 rather than 2010. While the performance spread between tech and the S&P 500 has been relatively narrow to both the upside and downside in the last 15 years or so, prior to 2005, the range of out or underperformance was routinely in a wider range back then compared to the range it hasmoved between since 2005. Click here to view Bespoke’s premium membership options.

Chart of the Day: Nasdaq 100 (QQQ) Higher Opens After Recent Losses
Bespoke’s Morning Lineup – 2/23/22 – Turnaround Wednesday?
See what’s driving market performance around the world in today’s Morning Lineup. Bespoke’s Morning Lineup is the best way to start your trading day. Read it now by starting a two-week trial to Bespoke Premium. CLICK HERE to learn more and start your trial.
“Shut your eyes and see.” – James Joyce
Futures are trading higher heading into the opening bell…for now. It used to be that a positive tone in the futures market would suggest a positive tone to the upcoming trading day, but lately, futures are indicative of the market’s present tone and nothing else. Close your eyes or step away from the desk for a minute and the picture may look completely different when you get back. Along with futures in the green, bitcoin is trading up 3% and back near or above $39K (depending on when you look), crude oil is down slightly, and the 10-year yield is back up to 1.98%.
The only economic data point on the calendar was weekly mortgage applications which showed a decline of 13.1% compared to last week’s drop of 5.4%. Mortgage applications can be volatile, but last week’s drop was the steepest since April 2020 at the heart of the COVID lockdowns.
Read today’s Morning Lineup for a recap of all the major market news and events from around the world, including the latest US and international COVID trends.
If the S&P 500 was going to bounce one of these days, current levels provide a logical starting point as the S&P 500 closed yesterday just above 4,300 which is a level that has acted as support in the past eight months. How long that support holds in the current environment remains to be seen.

While YTD performance has essentially been a bloodbath for most stocks in the S&P 500 this year, stocks in the Energy sector have been living in an alternate reality. With an average YTD gain of 20.2%, stocks in the Energy sector are leading every other sector’s average YTD change by at least 20 percentage points! Stocks in the Financials sector have managed an average YTD gain of 0.2% this year, but every other sector’s average YTD change is negative. Sectors that have been the biggest laggards include Technology, Consumer Discretionary, and Real Estate where the average YTD change of each one’s components has been a decline of over 10%. Even in a traditionally defensive sector like Utilities, its components have already declined an average of 5.7% YTD.

Start a two-week trial to Bespoke Premium to read today’s full Morning Lineup.
The Closer – Ukraine Update, 2y Sale, Crude Crosscurrents, CoT – 2/22/22
Log-in here if you’re a member with access to the Closer.
Looking for deeper insight into markets? In tonight’s Closer sent to Bespoke Institutional clients, we begin tonight with a quick update on the situation in Ukraine and sanctions that were put into place today. We also touch on the market reaction to this news. Next, we recap some earnings news out after the closing bell and take a look at crude oil markets. We then dive into the solid 2-year note auction followed by a look at today’s economic data including home prices, consumer sentiment, preliminary Markit PMIs, and an update of our Five Fed Manufacturing composite. We finish with an update of the most recent CoT data.

See today’s post-market Closer and everything else Bespoke publishes by starting a 14-day trial to Bespoke Institutional today!
Daily Sector Snapshot — 2/22/22
Chart of the Day: Nasdaq ‘Death’ Cross
Ukraine: Now vs 2013-2014
In late 2013 and for the majority of 2014, Ukraine was central in the geopolitical news cycle, as Russia moved to annex Crimea. There was a large divergence within the country between pro-Russian separatists and Ukrainian loyalists, which caused months of unrest. In November of 2013, the Ukrainian President abandoned a favorable trade deal with the EU in favor of Russia, which sparked protests in Kyiv and other major cities. To make Ukrainian citizens feel better about their inherent reliance on Russia, Putin’s Russian government retired $15 billion of Ukrainian debt and reduced the price of oil being supplied to the nation. However, just a few months later, protests began turning deadly as the two groups once again collided. It soon became clear that Russia had a serious opportunity to make a move into land that was previously held by the USSR, and this caused consternation and outrage in Western nations. The Russian parliament soon approved the use of force in Ukraine to protect Russian interests, and it wasn’t long until sanctions were imposed by the US and Europe. Sanctions issued to Russia by the US in 2014 included travel restrictions, limited financing for Russian financial and energy companies, and additional measures to impact Putin’s ‘inner circle’.
In March of 2014, President Obama urged Moscow to “move back its troops” and ease tensions, but there was little change on the Russian front. In April, the US, EU, Ukraine, and Russia met in Geneva to attempt to de-escalate the situation diplomatically while Ukraine’s acting President authorized the use of military force against pro-Russian militants in Eastern Ukraine after Crimea voted to secede from Ukraine in what the West considered a highly manipulated referendum. While Russia’s actions led to a tense situation, conditions eased after Crimea was officially annexed. In June 2014, Russia canceled the authorization of military forces in Ukraine, and soldiers were soon returned to their bases. As troops were withdrawn, Ukraine signed a truce with pro-Russian militants, and the situation appeared resolved. Russia gained Crimea, but the rest of Ukraine (with a few exceptions) remained independent from the Russian Federation.
During this time period, the S&P 500 experienced increased volatility, but investors rushed to buy the dips. Between November of 2013 and 2014, the S&P 500 gained 13.5% and averaged a daily absolute change of 51 basis points (bps). During this time period, the S&P 500 traded down at least 5 percent from a high two times, but the index traded over 3% below highs for 12.2% of trading days (30/245). It is worth noting that only one pullback came immediately after headlines were published about a deteriorating situation, so from the perspective of US investors, there was little concern over the Ukraine situation.
Although the situation is certainly different this time around, the backdrop is relatively similar. Russia is becoming increasingly aggressive in its efforts to annex part or all of Ukraine, and troops are aligning across the border. Putin has made countless threats regarding Ukraine joining NATO, stating that this action would result in a European-Russian war. Due to the nature of the NATO agreement, this would essentially result in a global war, but since Ukraine is not currently part of NATO, it is highly unlikely that the US or EU will intervene militarily. However, the US and EU have threatened more severe sanctions than were seen in 2014, including prohibiting new investments, trade, or finance activities to bad actors in Ukraine. Most notably, there have been threats made to Russia regarding sanctions that would cut off Russia from access to the US Dollar system, which would significantly derail the Soviet economy.
With the situation more severe now than it was in 2014 and the threatened sanctions being quite different, equity market performance during this crisis has been far worse. 2014 was not an environment where the Fed was hiking rates, so the two occurrences have diverging macroeconomic backdrops. Nonetheless, this time around, the market does seem far more concerned about the Ukrainian situation than it did in 2014. The average absolute daily percent change of the S&P 500 since November 10th, when the crisis first started to flare up, has been 91 basis points, which is well above historical averages. The biggest selloff in this time period, which occurred between 1/14 and 1/21, came on the back of the headline that Russian troops began to arrive in Belarus for ‘military drills’. Also in this period, the US announced an additional $200 million in security aid to Kyiv, and NATO troops were placed on standby to bolster the EU’s Eastern defense. Since the first headline regarding Russian aggression in Ukraine emerged, the S&P 500 has shed 7.1% and is currently sitting at its lowest level since the news emerged, and there have been two separate 5%+ declines from a short-term high.
Again, it’s hard to properly weigh what impact various factors have had on the market’s decline in the last few months, but the market certainly appears much more concerned with how the situation will play out this time around than it was regarding Crimea in 2013 and 2014. Click here to view Bespoke’s premium membership options.

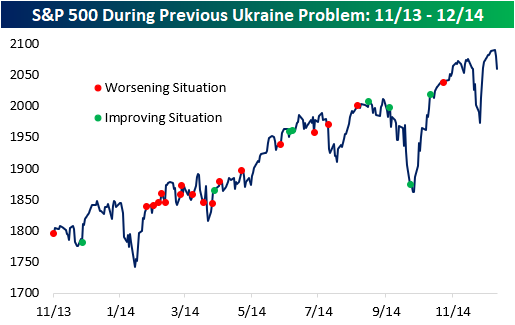
To look at this another way, in the chart below we compare the S&P 500’s cumulative performance during each of the Ukraine crises. For the current period, we used 11/10/21, which was when the first headlines surfaced regarding Russian troop buildups near the Ukrainian border. For the 2013/2014 period, the start date used was 11/21/13 which was when protestors began to gather in Kyiv after President Viktor Yanukovych abandoned an agreement on closer trade ties with the EU opting instead for another deal favoring Russia.
When comparing the cumulative equity market returns during the two periods, for the first two months, the pattern tracked each other pretty closely. Beginning in the last couple of weeks when the US publicly ramped up concerns that a Russian invasion of the region was imminent, though, any hopes of a continued bounce have been dashed. Again, Ukraine hasn’t been the only issue impacting markets in the past few days. The recent leg lower also began right around the time that St.Louis Fed President James Bullard began calling for a 50 bps rate hike, and Ukraine or not, that type of headline wouldn’t be supportive of equity prices. Click here to view Bespoke’s premium membership options and to sign up for a trial to any of them.
