Bespoke’s Weekly Sector Snapshot — 2/24/22
The Bespoke 50 Growth Stocks – 2/24/22
The “Bespoke 50” is a basket of noteworthy growth stocks in the Russell 3,000. To make the list, a stock must have strong earnings growth prospects along with an attractive price chart based on Bespoke’s analysis. The Bespoke 50 is updated weekly on Thursday unless otherwise noted. There were no changes to the list this week.
The Bespoke 50 is available with a Bespoke Premium subscription or a Bespoke Institutional subscription. You can learn more about our subscription offerings at our Membership Options page, or simply start a two-week trial at our sign-up page.
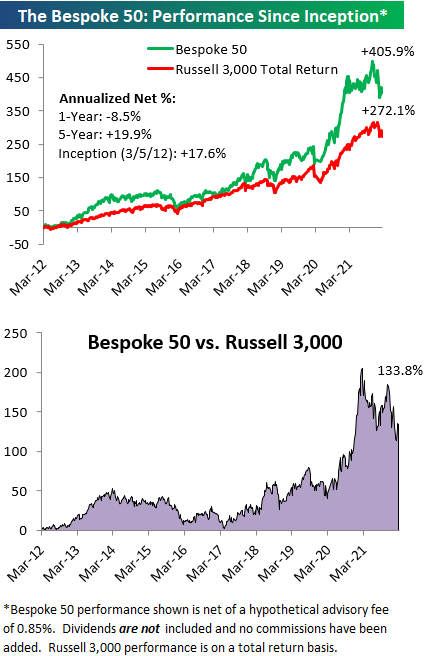
The Bespoke 50 performance chart shown does not represent actual investment results. The Bespoke 50 is updated weekly on Thursday. Performance is based on equally weighting each of the 50 stocks (2% each) and is calculated using each stock’s opening price as of Friday morning each week. Entry prices and exit prices used for stocks that are added or removed from the Bespoke 50 are based on Friday’s opening price. Any potential commissions, brokerage fees, or dividends are not included in the Bespoke 50 performance calculation, but the performance shown is net of a hypothetical annual advisory fee of 0.85%. Performance tracking for the Bespoke 50 and the Russell 3,000 total return index begins on March 5th, 2012 when the Bespoke 50 was first published. Past performance is not a guarantee of future results. The Bespoke 50 is meant to be an idea generator for investors and not a recommendation to buy or sell any specific securities. It is not personalized advice because it in no way takes into account an investor’s individual needs. As always, investors should conduct their own research when buying or selling individual securities. Click here to read our full disclosure on hypothetical performance tracking. Bespoke representatives or wealth management clients may have positions in securities discussed or mentioned in its published content.
Richmond Fed Keeps Rising
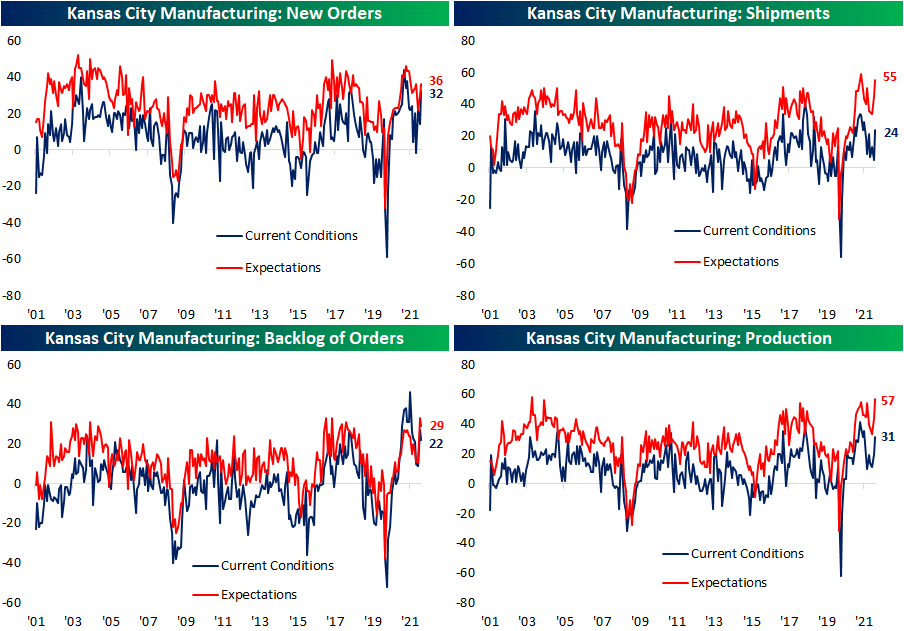
The Kansas City Fed’s February reading on manufacturing activity was expected to grow at an accelerated rate with forecasts calling for the headline number to rise from 24 to 25. Instead, the actual reading came in even higher at 29. That is the strongest reading on the region’s manufacturing economy since last May. Similar to the Richmond Fed report on Tuesday, expectations saw a similarly impressive reading rising to 38 which is tied with last April for the highest reading on record.

Relative to other regional Fed reports released this month, the Kansas City Fed’s survey has generally seen stronger results. As shown below, nearly every category across current conditions and future expectations sit in the top decile of their respective historical ranges and breadth was generally positive. The only indices that declined month over month were not outright negatives with declines in things like prices, order backlogs, and delivery times.
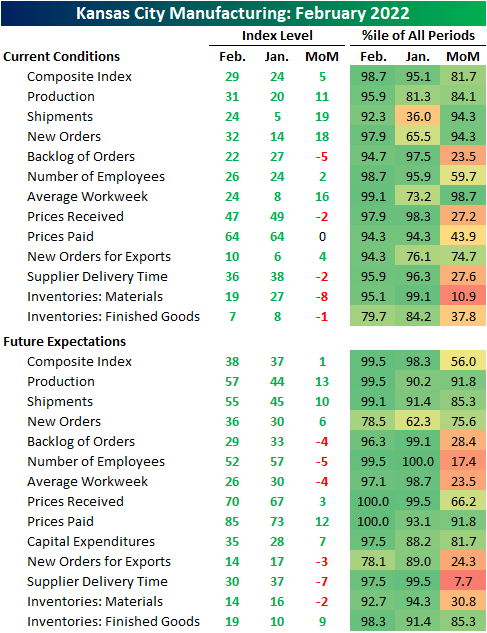
Of the indices that were higher, the biggest gains came from New Orders, Shipments, and Production. Each of these categories rose double digits month over month. While those increases bring these readings into the top decile of their historical ranges, they have not fully recovered the peaks from earlier in the pandemic. Expectations indices are in a similar situation with significant increases (except for order backlogs) this month. Production has seen the most notable increase of these as this month’s reading on expectations hit the second-highest level on record behind the October 2003 reading.
The report showed supply chains remain stressed but improved as delivery times fell another 2 points marking the third decline in a row.

The report’s readings on prices showed a wide divergence between current conditions and expectations. Both indices had generally been on the decline from extremely high levels in the past year, but over the past two reports, expectations have surged with both prices paid and received hitting new record highs. Meanwhile, current conditions have only flattened out after reversing lower in the second half of 2021. Click here to view Bespoke’s premium membership options.

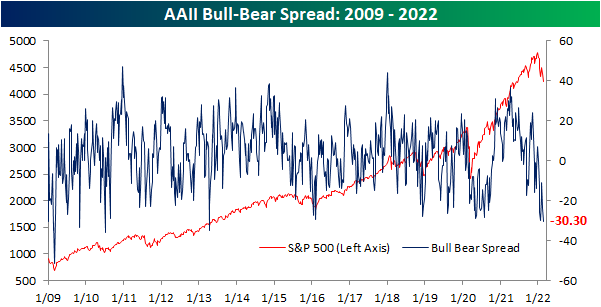
Neutral Sentiment Plunges as Bears Move Back Above 50%
As the S&P 500 enters correction territory, sentiment has further degraded. Once again this week, less than a quarter of respondents to the weekly AAII sentiment survey reported as bullish. Although it was an improvement from 19.2% last week, the current reading of 23.4% remains in the 6th percentile of readings going back to the start of the survey in 1987. We would also note that while there are a range of potential factors that have likely played a role in the recent drop in sentiment ranging from price action to forecasted paths of interest rates to geopolitical tensions, this week’s survey likely did not fully capture changes to sentiment from the news surrounding the situation in Ukraine. More specifically, the collection period would not have captured today’s news of escalation.
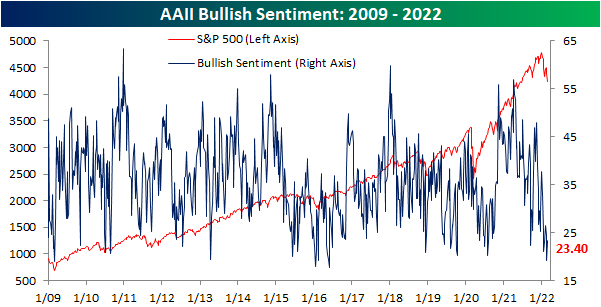
Bearish sentiment crossed above 50% as recently as the last week of January, and after falling all the way back down to 35.5% earlier this month, it is now back above 50%. In fact, bearish sentiment surpassed the January high of 52.9% by 0.8 percentage points this week to reach the highest level since April 2013. Back then it was only slightly higher at 54.48%. The two-week increase since the low on February 10th now ranks in the top 3% of all two-week changes on record. As for other sentiment surveys, the bearish results are being echoed with the Investors Intelligence survey seeing the highest bearish reading since April 2020.

With the huge pickup in bearish sentiment, the bull-bear spread has fallen below -30. Similar to bearish sentiment, that is the most pessimistic reading on sentiment since April 2013.
With both bullish and bearish sentiment rising, each reading’s gains have borrowed heavily from neutral sentiment. Neutral sentiment has gone from a multi-year high of more than 40% only two weeks ago down to the lowest level since last April this week. The bulk of that decline occurred since last week’s survey as neutral sentiment plummeted 14.7 percentage points week over week. There has not been as large of a decline in neutral sentiment since February 2003.

Given how severe of a decline neutral sentiment experienced this week, in the table below we look back at all other times that this reading has experienced a double-digit percentage point decline for the first time in at least six months. Of the baker’s dozen of prior occurrences, the current instance ranks as the second-largest decline in neutral sentiment behind the August 1994 instance when it fell 15 percentage points. There were also three other times—March 2005, July 2010, and April 2013—when, similar to now, bearish sentiment was above 50%. Overall across these past occurrences, the S&P 500 has tended to outperform in the short term but longer-run performance (3 months to one year out) has been smaller than the norm for all periods. In the three periods most similar to the present period, though, where nearish sentiment was also above 50%, forward returns three, six, and twelve months later were higher each time Click here to view Bespoke’s premium membership options.

Chart of the Day: Gaps Out Of Oversold Territory
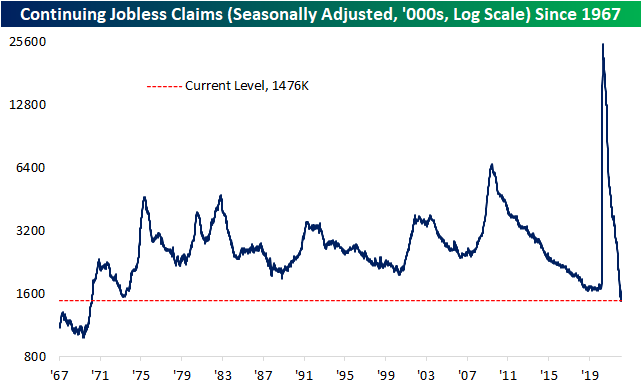
Continuing Claims At Lowest Level Since 1970
Initial jobless claims came in 3K lower than expected this week falling from 248K to 232K. While it does not take away from the fact that the current level of claims is at the low end of the historical range, this week’s number remains 44K above the multi-decade lows set in late 2021.

On a non-seasonally adjusted basis, claims remain within the range of readings from the few years leading up to the pandemic. This week saw a drop from 239.7K to 214.9K; the lowest level since March 2020. Claims continue to generally follow the usual seasonal pattern and the next few weeks of the year have historically tended to mark a short-term seasonal low. In other words, some minor seasonal headwinds are on the horizon.

Continuing claims experienced a significant drop this week falling by 112K to 1.476 million. Not only did that exceed expectations by over 100K, but that also marked the largest decline of 2022 to bring claims to the lowest level since March 1970. Click here to view Bespoke’s premium membership options.
Oil Tops $100 Per Barrel
For the first time since September of 2014, the price of brent crude oil has topped $100. This occurred on the back of Russia’s invasion of Ukraine, which unleashed a slew of sanctions against Russia from the US & EU, sparking flash backs to the Cold War. Diplomatic relations between Russia and the West are deteriorating, and NATO Secretary General Jens Stoltenberg commented, “Peace in our continent has been shattered. We now have war in Europe, on a scale and of a type we thought belong to history.”
Russia is the world’s second largest producer of natural gas (behind the US) and the third largest producer of oil, as per the US Energy Information Administration. Additionally, Russia has the second largest spread between oil produced and oil used (behind just Saudi Arabia), giving the country a key roll in supplying oil to the rest of the world.
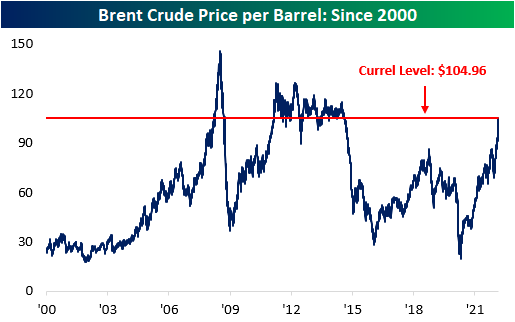
The last time that oil topped $100 per barrel for the first time in three months was in January of 2011. In just two months, the price of oil shot 17.6% higher, resulting in a y/y price increase of 41.4%. This occurred on the back of political turmoil in the Middle East, particularly in Egypt, Lebanon, Yemen and Bahrain. These conflicts caused speculation of continued unrest in the entire region, thus pulling into question the ability for the Middle East to adequately supply the world with oil. This occurred while demand for fossil fuels remained robust, hence the soaring price of oil. Oil did not definitively break back below $100 per barrel level until September of 2014, when OPEC increased output, oil production in the US began to boom and the Middle East’s geopolitical situation eased. The combination of these three factors sent the price of oil tumbling, falling by 51.8% in less than five months.
In 2008, the sky-rocketing in the price of oil was largely demand driven. In late February, oil topped $100 after considerable demand increases crossed with a stagnant supply. Oil moved continuously higher over the preceding 12 months, gaining 63.0% when all was said and done. However, the global financial crisis, also known as the great recession, caused a severe reduction in economic activity and demand, sending the price of oil tumbling by 58.2% in just one year following the initial topping of $100 per barrel.
Below is a set of graphs that shows the performance of the S&P 500 during these periods. As you can see, a rise in the price of oil does not necessarily imply a market pullback. In fact, a high price of oil insinuates that economic activity is strong and demand is robust.


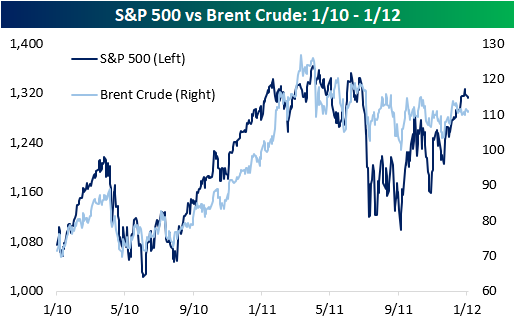
Whereas the correlation coefficient between brent crude and the S&P 500 is just 0.07 since the turn of the century, the correlation in the year before and after oil tops $100 for the first time was 0.40 between February of 2007 and 2009 and 0.84 between January of 2010 and 2012. These coefficients signify a moderate and strong positive relationship, respectively. When oil eventually definitively moved below $100 per barrel later in 2008, the S&P 500 crashed alongside oil prices, but the opposite was seen in 2011. Needless to say, the market is influenced by a multitude of factors, and oil is simply a single input.
Although we don’t have much data to go on, the forward performance of the market has been closely tied to the performance of brent crude after oil has topped $100 since 2000. In 2008, crude crashed just as quickly as it had risen, and the market followed suit. On the other hand, the price of crude remained elevated following the topping of $100 in 2011, and the market performed positively, but the forward year performance was lesser than the average since the turn of the century (3.1% vs 6.8%). In both occurrences, the price of brent crude climbed higher over the course of the next three months. In 2008, the price of brent crude rose by 29.8% in the next three months and 13.6% over the following six months. However, one year later, the price had crashed by 59.4%. In 2011, brent crude appreciated by 24.6% in the following three months, 15.6% in six months and 8.7% in a year. However, insinuating that the crash in 2008 had anything to do with oil would be a mistake. In fact, the inverse is likely true. Long story short, investors should not sell this dip due to the hike in oil prices alone, but there is much more to consider in the current macro environment. Click here to view Bespoke’s premium membership options.


Bespoke’s Morning Lineup – 2/24/22 – The Nasdaq Bear Growls
See what’s driving market performance around the world in today’s Morning Lineup. Bespoke’s Morning Lineup is the best way to start your trading day. Read it now by starting a two-week trial to Bespoke Premium. CLICK HERE to learn more and start your trial.
“Do not try to make circumstances fit your plans. Make plans that fit the circumstances”. – George S. Patton
It’s setting up to be a painful morning for investors in the US and around the world as financial markets are reeling in every corner of the world. It’s safe to say that markets weren’t expecting such a rapid escalation and Russian airstrikes throughout Ukraine, so the negative reaction is warranted. That being said, it’s not as though markets were anywhere near their highs heading into today. The Russell 2000 was already in a bear market, the Nasdaq was knocking on the door, and the S&P 500 was in correction territory.
Economic data this morning was mixed with jobless claims coming in lower than expected, but inflation-related indices like the GDP Price Index and Core PCE both came in higher than expected. Given the macro headlines, though, futures have seen little in the way of an impact.
Read today’s Morning Lineup for a recap of all the major market news and events from around the world, including the latest US and international COVID trends.
Based on where futures stand now, the Nasdaq will open for trading with a decline of about 3%, putting the index down 21% from its record high back in November. In the history of the index dating back to 1971, this will be the 12th drawdown of 20%+ from a record high. What’s also worth highlighting is that the current drawdown represents the 3rd 20%+ drawdown from a record high in the last 3.5 years.
On a related note, today could mark the fifth straight 1%+ decline for the Nasdaq which would be the longest streak of 1% daily declines since October 2008.

Start a two-week trial to Bespoke Premium to read today’s full Morning Lineup.
Daily Sector Snapshot — 2/23/22
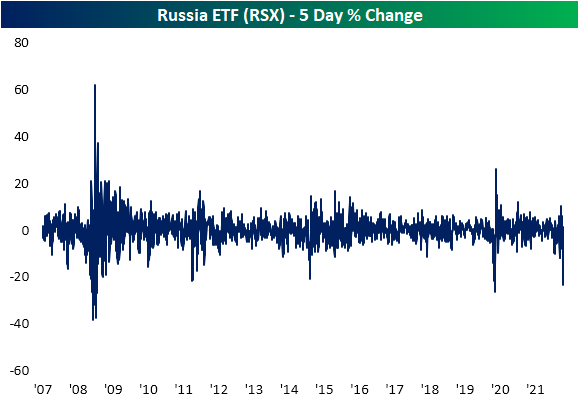
Russia (RSX) Falling Off the Table
As it is the last Wednesday of the month, earlier today we published our Global Macro Dashboard offering a glance at the economic and market data of 22 major global economies. Looking across the US-listed ETFs tracking each of these country stock markets, it should come as no surprise as to which country currently finds itself at the bottom of this list, and it isn’t even close: Russia (RSX). RSX is now down 42% from its 52-week high set back in October and is down 27.59% year to date. That leaves the ETF over three standard deviations below its 50-DMA, but only one week ago, it was actually above its 50-DMA!
As for the rest of the countries tracked, half are oversold with multiple others including Germany (EWG) and China (MCHI) over two standard deviations below their 50-DMAs. The United States (SPY) actually ranks as the third-worst country of these with regards to year-to-date performance. Brazil (EWZ), South Africa (EZA), and Malaysia (EWM) are overbought and sitting on some of the largest (and only) year-to-date gains.
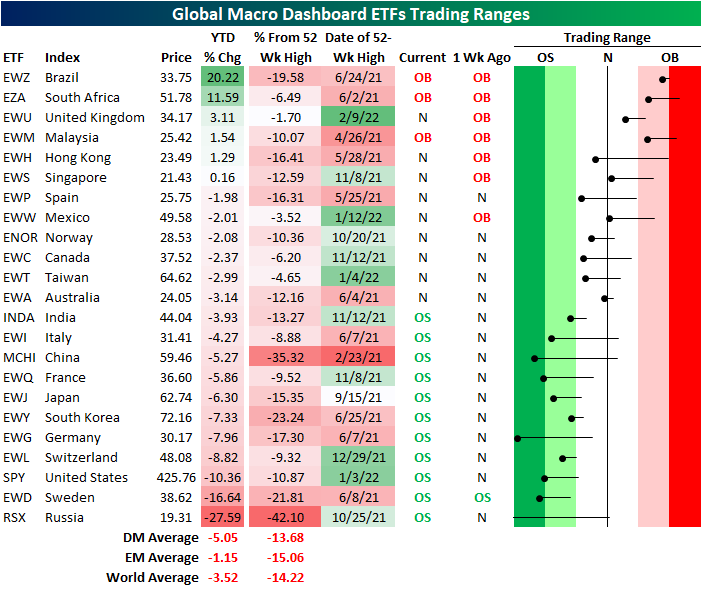
The BRIC countries find themselves on opposite ends of the spectrum of performance. While RSX and MCHI are at or close to 52-week lows, and India (INDA) is near multi-month support, Brazil (EWZ) is sitting on a sizable 20% YTD gain. That being said, it also still remains nearly 20% below its 52-week high set last spring even after the massive rally this year. Taking a look at the chart of RSX, it has been in a downtrend since last fall, and right before the Ukraine episode began, it was actually looking like it had a chance to break out as it ran up to its 50-DMA. After failing to move above that moving average coincident with rising geo-political tensions, RSX has absolutely fallen off the table over the last couple of weeks.

As for just how steep of a drop RSX has faced, the ETF has shed 23.42% in the past five sessions alone. Since the ETF began trading in the mid-2000s, there have only been a handful of other periods in which it has fallen by as large of a degree in only five days. The most recent of these was in the spring of 2020 at the onset of the pandemic. While the decline wasn’t as large as now, 2014 was another period that saw RSX fall over 20% in five days as geopolitical tensions arose in Ukraine. 2008 and 2011 were the only other periods prior to that in which RSX has experienced such a large decline in as short of a span. Click here to view Bespoke’s premium membership options.