AAII Sentiment Improves While Other Surveys Plummet
The S&P 500 has been fighting to regain some of its lost ground in the past week working its way out of oversold territory at yesterday’s close in the process. As a result, investor sentiment has taken a more optimistic tone this week as the AAII sentiment survey showed the percentage of respondents reporting as bullish climbed back above 30% for the first time since the first week of the year. In total over the past two weeks, bullish sentiment has now risen 11.2 percentage points. While improved, that still leaves bullish sentiment several percentage points below its historical average of roughly 38%.

The gains to bullish sentiment borrowed heavily from an extremely elevated reading in bearish sentiment. Last week over half of the respondents reported as bearish after a 10.5 percentage point increase week over week. This week that has dropped all the way down to 41.4%. That 12.3 percentage point decline was the largest drop since October 2019 when it fell 12.91 percentage points to a much lower 31%. This also marks the first time bearish sentiment rose double-digits then fell double digits in back-to-back weeks since February 2016.

In spite of the big drop to bearish sentiment, they continue to heavily outnumber bulls with an 11 point spread between bullish and bearish sentiment. That is improved from last week’s reading of -30.3 but remains at the low end of the recent range.

While the AAII survey results showed an improvement in sentiment, other sentiment surveys showed the opposite. The Investors Intelligence survey saw the lowest reading on bullish sentiment since February 2016 and the NAAIM Exposure index showed investment managers are basically market-neutral as the index saw the lowest reading since the COVID crash. Combining all of these readings into our Sentiment Composite, the gains to AAII sentiment in the past couple of weeks has brought the composite off the lows, but current levels are still some of the most bearish of the past decade. The only lower readings were in the spring of 2020 and early 2016. Click here to view Bespoke’s premium membership options.

Chart of the Day: Commodity-Led Recessions
High Levels of Volatility
It’s been a volatile start to 2022 so far. With an average intraday trading range of two percentage points, the S&P 500’s average intraday range in the first 41 trading days of the year has been the widest since 2009, and the only other year besides 2009 where the average range was wider was 2008.

High levels of intraday volatility tend to coincide with periods of elevated uncertainty among investors and typically occur during periods when the market is lower. When the average daily range of the S&P 500 has been more than 1.5 percentage points during the first 41 trading days of the year, the average YTD performance of the S&P 500 was a decline of 5.7% (median: -4.3%). This significantly trails the average gain of 1.3% (median: 2.0%) of all years since 1983. So far this year, the S&P 500 has had the second-worst start since 1983 trailing just 2009, when the S&P 500 tanked 25.3% in the first 41 trading days.
Regarding forward returns after these volatile starts, returns vary. Although performance over the following one and three months tended to be better than average and more consistent to the upside, over the following six months and for the rest of the year, performance was more mixed. Click here to view Bespoke’s premium membership options.

Unusual Seasonal Strength From Claims
Jobless claims were expected to fall to 225K this week, but the decline was even larger as first-time claims fell to 215K. That marked an 18K decline from last week’s slight upwardly revised number of 233K and is the lowest level of claims since the final week of 2021.
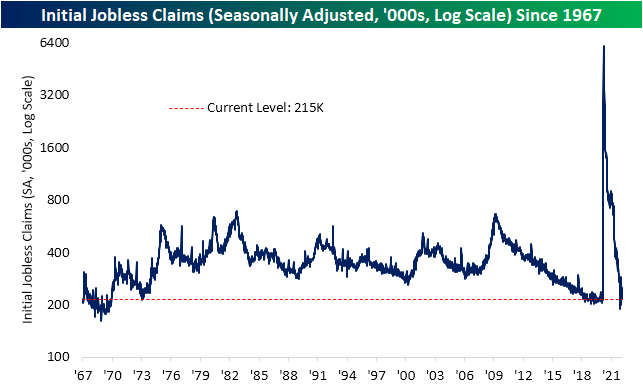
On a non-seasonally adjusted basis, it was a very impressive week. Claims dropped to 194.7K, and after revisions, it is the first sub 200K print since March 2020. That also makes for the lowest level of the current week of the year on record. The 21.3K improvement from last week is also seasonally unusual. The current period of the year has historically marked a temporary low in the average reading on claims (second chart below). Additionally, the current week of the year has infrequently seen claims fall as they did this week. Throughout history, the ninth week of the year has been one of the most consistent periods in the first half of the year to experience week over week increases in claims. In fact, historically the current week of the year has seen claims rise WoW over 70% of the time and prior to this year, the last time the current week of the year saw a lower reading on claims was 2011.

Continuing claims were less impressive this week. While last week’s reading was revised down by 2K to 1474K, this week’s number was slightly higher at 1476K. That compares to estimates of further declines down to 1420K. Even though the most recent reading disappointed, the current level of claims is still well below the range of readings from the past several decades. Click here to view Bespoke’s premium membership options.

Bespoke’s Morning Lineup – 3/3/22 – Is This Thing On?
See what’s driving market performance around the world in today’s Morning Lineup. Bespoke’s Morning Lineup is the best way to start your trading day. Read it now by starting a two-week trial to Bespoke Premium. CLICK HERE to learn more and start your trial.
“He who knows when he can fight and when he cannot will be victorious.” – Sun Tzu
After a seemingly endless run of days where the futures indicated big moves at the opening bell, this morning, futures on all of the major averages are very little changed fluctuating on either side of unchanged. Even bitcoin is flat on the day! It’s not like there is a lack of potential catalysts, though. We have weekly jobless claims at 8:30, and then at 10, we’ll get the latest reads on Services PMI, Factory Orders, and Durables Goods. Also, don’t forget about Powell’s testimony at 10 AM, and continued developments out of Ukraine..
Jobless claims were just released, and while initial claims were expected to come in at a level of about 230K, the actual reading came in at 215K. Continuing claims were forecast to drop to around 1.44 million, and that reading came in higher than expected rising to 1.476 million which was unchanged from last week.
Read today’s Morning Lineup for a recap of all the major market news and events from around the world, including the latest US and international COVID trends.
With little change in the futures this morning, we thought this would be a good time to take a look at the technical picture for the major US indices. While yesterday’s bounce was welcome, it did little to improve the downtrends in the major averages.
The S&P 500 tracking ETF (SPY) hit a two-week high yesterday, which is less common this year than hitting record highs was last year. Despite the gains, though, the index has yet to even test its downtrend or 200-DMA which doesn’t come into play until around 4,450 on the index and about 445 for the ETF.

Start a two-week trial to Bespoke Premium to read today’s full Morning Lineup.
Gun Background Checks Continue to Fall
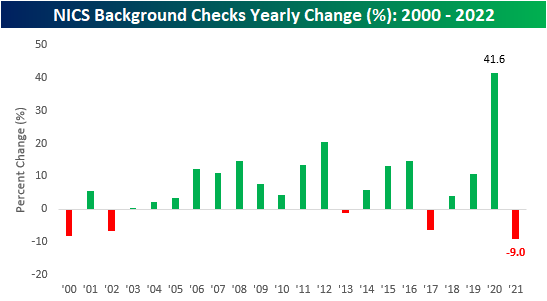
As COVID becomes endemic, levels of anxiety across the country have been declining. At the beginning of the pandemic, uncertainty in the political climate caused by riots and pandemic-related restrictions pushed Americans to rush to their local sporting stores to purchase firearms, resulting in a y/y percent increase in background checks that was second only to the spike seen after Obama’s second term began. In July 2020, FBI background checks spiked by 79.2% y/y, just two percentage points less than the increase seen in January of 2013. However, the absolute number of checks in July of 2020 was 1.14 million higher than the figure from January 2013 (3.64 million vs 2.50 million). In March 2021, background checks topped out at 4.69 million, the highest monthly figure on record. The number of background checks has somewhat normalized since then, resulting in just 2.55 million checks being run in February, albeit a slightly shorter month. Click here to view Bespoke’s premium membership options.


On a full-year basis, 2021 saw total background checks decline by 9.0% to 31.1 million. However, this came off of a record year in 2021, in which checks increased by a whopping 41.6% to 34.2 million. In the first two months of 2022, total background checks have declined by 358,669 YTD or 6.5%.

As you may have assumed, the pullback in background checks does not bode well for the gun manufacturing stocks. Below are the charts of Sturm Ruger (RGR) and Smith and Wesson (SWBI) over the last 12 months. RGR is currently 19.9% off of its high but has rebounded since Russia’s invasion of Ukraine. As the international geopolitical situation becomes increasingly uncertain, firearm sales will likely increase, which has been represented in RGR’s 13.7% upside move in the last week. SWBI is performing far worse, down 54.6% from its 52-week highs. The stock has moved 12.4% higher in the last week but remains deep in the hole. In addition, both of these stocks have been impacted by the legal ruling that could hold gun manufacturers liable for incidents involving their firearms. Previously, these companies were entirely immune from litigation.

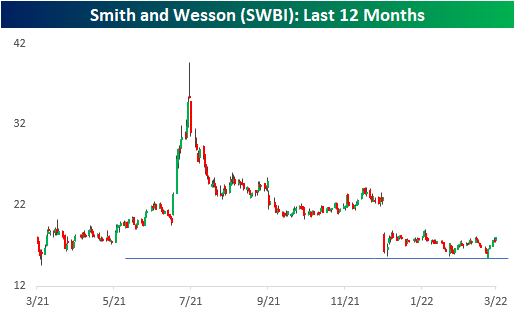
As expected, there is a high correlation between the performance of RGR and the number of background checks run over the last twelve months. Since 2000, the correlation coefficient between these two data sets is 0.90, which signifies a strong positive relationship. Should the Ukrainian conflict boost background checks, look for continued strong performance from the gun manufacturers.

Daily Sector Snapshot — 3/2/22
Chart of the Day – Crude Oil and US Dollar Index Surge
Banks (KRE) Swing Wildly
While Financials are the best performing sector so far in today’s session, leading into today it was the worst-performing sector over the past week thanks in large part to a 3.7% decline on Tuesday; the sector’s worst single day since June 2020. Looking more specifically at bank stocks, using the SPDR S&P Regional Banking ETF (KRE) as a proxy, yesterday saw an even more dramatic decline of 5.47% marking the largest decline since November 2020. That drop also ranks in the bottom 1% of all daily changes on record since the ETF began trading in 2006. The over 3.5% rebound today, meanwhile, ranks in the top 5% of all days on record as yesterday’s decline was not quite enough to drop the industry below its 200-DMA; a support level that has now held multiple times in the past year.
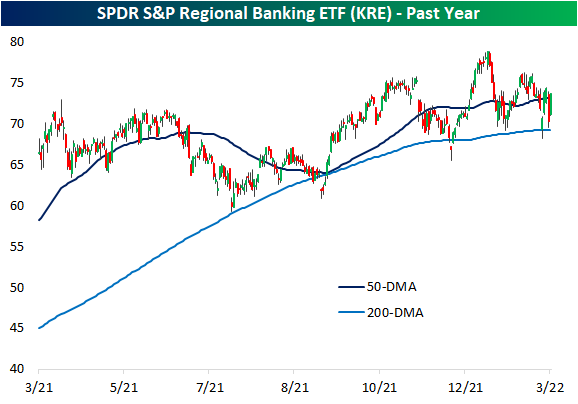

As previously mentioned, it is rare for KRE to fall over 5% in a single day. Excluding yesterday, there were 68 other times this happened but only a dozen of those occurred with at least 3 months between the prior instance. In the table below, we show the performance of KRE after each of those periods.
While it is far from the case today, typically, the next day has often seen KRE fall further after a 5% drop. Instead, today it is seeing the second-best next-day performance of these instances. As for where things go from here though, returns have been weaker than the norm one week and one month following these past occurrences. KRE has then tended to outperform all other periods three, six, and twelve months out. Click here to view Bespoke’s premium membership options.

Q4 Earnings Season Conference Call Recaps
Bespoke’s Conference Call recaps provide helpful summaries of corporate conference calls throughout earnings season. We go through the conference calls of some of the most important companies in the market and summarize key topics covered by management. These recaps include information regarding each company’s financial results, growth by segment, as well as some aspects of the business that management expects to impact future results. We also identify trends emerging for the broader economy in these recaps.
Bespoke’s Conference Call recaps are available at the Bespoke Institutional level only. You can sign up for Bespoke Institutional now and receive a 14-day trial to read our newest Conference Call recaps. To sign up, choose either the monthly or annual checkout link below:
Bespoke Institutional – Monthly Payment Plan
Bespoke Institutional – Annual Payment Plan
Below is a list of the Conference Call recaps published during the Q4 2021 earnings reporting period.
Latest Recaps:
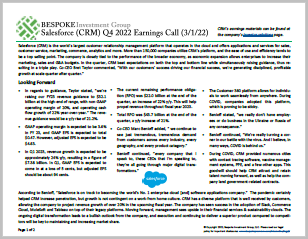
Salesforce — Q4 2022
Target — Q4 2021

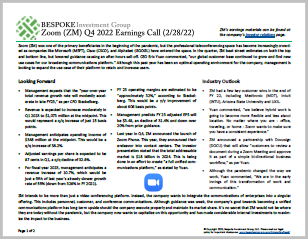
Zoom — Q4 2022
Q4 Previously Published Recaps
Moderna Q4 Conference Call — 2/24/22
Home Depot Q4 Conference Call — 2/22/22
Deere Q1 Conference Call — 2/18/22
Walmart Q4 Conference Call — 2/17/22
NVIDIA Q4 Conference Call — 2/16/22
Airbnb Q4 Conference Call — 2/15/22
Marriott Q4 Conference Call — 2/15/22
Advance Auto Parts Q4 Conference Call — 2/14/22
Uber Q4 Conference Call — 2/9/22
Disney Q1 Conference Call — 2/9/22
Chipotle Q4 Conference Call — 2/8/22
Simon Property Q1 Conference Call — 2/7/22
Tyson Foods Q1 Conference Call — 2/7/22
Snap Q4 Conference Call — 2/3/22
Amazon Q4 Conference Call — 2/3/22
Estée Lauder Q2 Conference Call — 2/3/22
Meta Q4 Conference Call — 2/2/22
Ferrari Q4 Conference Call — 2/2/22
Match Group Q4 Conference Call — 2/2/22
Advanced Micro Devices Q4 Conference Call — 2/1/22
PayPal Q4 Conference Call — 2/1/22
Starbucks Q1 Conference Call — 2/1/22
Alphabet Q4 Conference Call — 2/1/22
United Parcel Service Q4 Conference Call — 2/1/22
Visa Q1 Conference Call — 1/27/22
Apple Q1 Conference Call — 1/27/22
McDonald’s Q4 Conference Call — 1/27/22
Intel Q4 Conference Call — 1/26/22
Tesla Q4 Conference Call — 1/26/22
Boeing Q4 Conference Call — 1/26/22
Automatic Data Process Q4 Conference Call — 1/26/22
Microsoft Q2 Conference Call — 1/26/22
Johnson & Johnson Q4 Conference Cal — 1/25/22
3M Q4 Conference Call — 1/25/22
Lockheed Martin Q4 Conference Call — 1/25/22
American Express Q4 Conference Call — 1/25/22
Netflix Q4 Conference Call — 1/20/22
Intuitive Surgical Q4 Conference Call — 1/20/22
Union Pacific Q4 Conference Call — 1/20/22
Baker Hughes Q4 Conference Call — 1/20/22
UnitedHealth Q4 Conference Call — 1/19/21
Fastenal Q4 Conference Call — 1/19/22
Procter & Gamble Q2 Conference Call — 1/19/22
Silvergate Capital Q4 Conference Call — 1/18/22
Charles Schwab Q4 Conference Call — 1/18/22
BlackRock Q4 Conference Call — 1/14/22
JP Morgan Q4 Conference Call — 1/14/22
KB Home Q4 Conference Call — 1/12/22
Delta Airlines Q4 Conference Call — 1/13/22
Constellation Brands Q3 Conference Call — 1/6/22
Nike Q2 Conference Call — 12/20/22
Recaps published during Q3 are available with a Bespoke Institutional subscription:
Zoom Q3 Conference Call — 11/23/2021
NVIDIA Q3 Conference Call — 11/17/2021
Target Q3 Conference Call — 11/17/2021
Home Depot Q3 Conference Call — 11/16/2021
Walmart Q3 Conference Call — 11/16/2021
Tyson Foods Q4 Conference Call — 11/15/2021
Flowers Foods Q3 Conference Call — 11/12/2021
Disney Q4 Conference Call — 11/10/2021
Coinbase Q3 Conference Call — 11/9/2021
TripAdvisor Q3 Conference Call — 11/9/2021
PayPal Q3 Conference Call — 11/8/2021
Johnson Controls Q4 Conference Call — 11/5/2021
Cloudflare Q3 Conference Call — 11/4/2021
AmerisourceBergen Q4 Conference Call — 11/4/2021
Lumen Technologies Q3 Conference Call — 11/3/2021
Diamondback Energy Q3 Conference Call — 11/2/2021
Sprout Social Q3 Conference Call — 11/2/2021
SolarEdge Technologies Q3 Conference Call — 11/2/2021
Simon Property Q3 Conference Call — 11/1/2021
Clorox Q4 Conference Call — 11/1/2021
Intercontinental Exchange Q3 Conference Call — 10/28/2021
Apple Q4 Conference Call — 10/28/2021
Amazon Q3 Conference Call — 10/28/2021
Merck Q3 Conference Call — 10/28/2021
United Rentals Q3 Conference Call — 10/28/2021
Ford Q3 Conference Call — 10/27/2021
Automatic Data Processing Q1 Conference Call — 10/27/2021
Boeing Q3 Conference Call — 10/27/2021
Evercore Q3 Conference Call — 10/27/2021
McDonald’s Q3 Conference Call — 10/27/2021
Alphabet Q3 Conference Call — 11/26/2021
Microsoft Q1 Conference Call — 11/26/2021
Digital Realty Q3 Conference Call — Q3 2021
3M Q3 Conference Call — 10/26/2021
Facebook Q3 Conference Call — 10/25/2021
Olin Q3 Conference Call — 10/21/21
Tesla Q3 Conference Call – 10/21/21
Equifax Q3 Conference Call – 10/21/21
Baker Hughes Q3 Conference Call – 10/21/21
Netflix Q3 Conference Call – 10/21/21
Intuitive Surgical Q3 Conference Call – 10/21/21
Johnson & Johnson Q3 Conference Call – 10/21/21
NextEra Energy Q3 Conference Call – 10/21/21