The Bespoke Report Newsletter — 3/18/22
Daily Sector Snapshot — 3/18/22
Bespoke’s Morning Lineup – 3/18/22 – Finishing Up on a Down Note
See what’s driving market performance around the world in today’s Morning Lineup. Bespoke’s Morning Lineup is the best way to start your trading day. Read it now by starting a two-week trial to Bespoke Premium. CLICK HERE to learn more and start your trial.
“Economics is a very difficult subject. I’ve compared it to trying to learn how to repair a car when the engine is running.” – Ben Bernanke
Early weakness in the futures yesterday gave way to the luck of the Irish as the major averages all closed sharply higher bringing the string of 1%+ gains for the S&P 500 up to three. Futures are a bit weaker this morning than they were at this time yesterday, so it may prove more difficult to turn the tide again today. This morning’s call between Biden and Xi at 9 AM could be an important catalyst regarding how the war in Ukraine plays out. China has been more favorable to the Russian side and has ramped up criticism of the US in recent days, with some officials in Washington worried that the country will start providing direct assistance to Russia.
The economic calendar is relatively quiet today with Existing Home Sales and Leading Indicators (both at 10 AM) the only reports on the calendar. St. Louis President James Bullard has already been out this morning saying he advocates a 3% Fed Funds rate by year-end and a more rapid reduction in the balance sheet.
Read today’s Morning Lineup for a recap of all the major market news and events from around the world, including the latest US and international COVID trends.
Movements in the crude oil market have been pretty nuts both recently and over the last two years. For starters, think about this. Over the last two years, crude oil has traded at both its lowest level EVER and within 12% of its highest price ever. 88% of its entire historical range in less than two years!
Over a shorter time window, prices have also been volatile. For just the sixth different period since the early 1980s, WTI crude oil has seen its average daily move exceed 4% over the last 50 trading days. As shown in the chart below, the last 50 trading days join 1986, 1990, 2008, 2016, and 2020 as one of the most volatile two-month periods for the commodity on record.
Not only has crude oil traded erratically, but the equity market’s reaction to moves in the crude oil market have also been hard to decipher. Take the equity market’s reaction to the daily moves on March 1st and yesterday. On both days, WTI rallied more than 8% and broke above $100 in the process. Yet on 3/1, the S&P 500 fell 1.55% in reaction to the move, while yesterday it rallied 1.23%. It just goes to show you that even if you could predict the future, knowing the market’s reaction would be far from a layup.

Start a two-week trial to Bespoke Premium to read today’s full Morning Lineup.
Craziness In Emerging Markets
Volatility in Chinese markets has caused the broader emerging markets ETF, EEM, to move aggressively to both the upside and downside over the last few trading days. Yesterday, EEM gained 8.05%, but the move came after the ETF moved 6.1% lower between last Thursday and Tuesday’s close. All-in-all, the ETF round-tripped to the levels seen on Wednesday of last week, but EEM is still down 8.5% year to date. Since EEM began trading in 2003, the ETF has gained a little over 300%, which constitutes annualized performance of 7.7%.
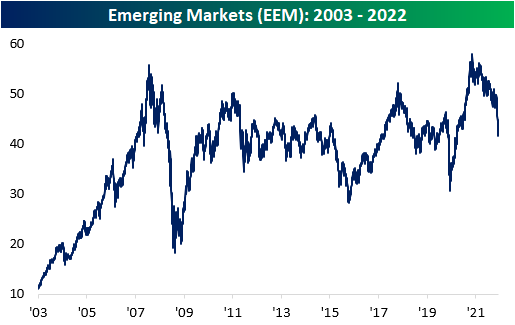
The move yesterday was high relative to historical daily moves, ranking as the 13th largest single-day upside move in its history. Larger moves were seen during the Financial Crisis and the COVID Crash. Obviously, these are not great periods to be compared to, but the occurrences were near the bottom of the pullbacks.

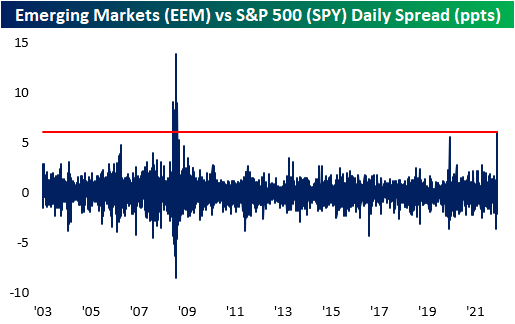
EEM’s daily spread versus the S&P 500 yesterday reached its highest positive level since the Financial Crisis. The last time the daily spread was above that of yesterday was on 11/21/08, in which the daily spread was +9.0%. The last time the spread even came close to this figure was during the COVID crash. Yesterday’s reading was 6.1%.
Bespoke’s Weekly Sector Snapshot — 3/17/22
Bears Come Out of Hibernation in Spite of Rebound
In spite of the S&P 500 gaining back some ground in the past week, sentiment has continued to shift in an increasingly pessimistic direction. For a second week in a row, less than a quarter of respondents to the AAII sentiment survey reported a bullish. At 22.5%, however, current levels are still slightly above the low of 19.2% from one month ago.

Bearish sentiment meanwhile climbed another 4 percentage points with just under half of respondents reporting as such. Albeit elevated, bearish sentiment is not as high as the 50%+ readings reached in January and February. As for another reading on bearish sentiment from the Investors Intelligence survey, bearish sentiment is at the highest level since the March 2020 COVID low.
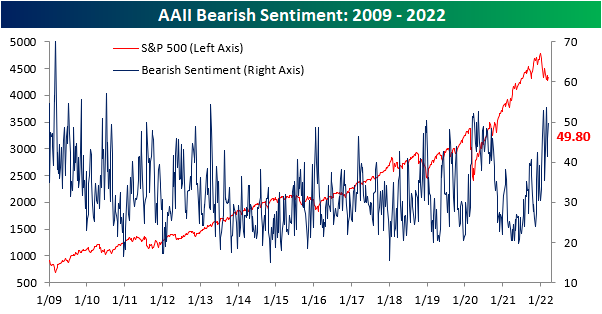
The bull-bear spread is extremely low at -27.3 but that is not quite as low as those past couple of weeks when over half of respondents reported as being bearish.

Not all of the increase to bears came from bulls. As shown below, neutral sentiment fell from 30.2% down to 27.8%. That is only the lowest level since the end of February. While bullish and bearish sentiment are both over a full standard deviation away from their historical averages, neutral sentiment is much more inline with its own historical average. Whereas all weeks since the start of the survey has seen neutral sentiment average a reading of 31.4%, this week’s reading was only a few percentage points away. Click here to view Bespoke’s premium membership options.

The Bespoke 50 Growth Stocks – 3/17/22
The “Bespoke 50” is a basket of noteworthy growth stocks in the Russell 3,000. To make the list, a stock must have strong earnings growth prospects along with an attractive price chart based on Bespoke’s analysis. The Bespoke 50 is updated weekly on Thursday unless otherwise noted. There were no changes to the list this week.
The Bespoke 50 is available with a Bespoke Premium subscription or a Bespoke Institutional subscription. You can learn more about our subscription offerings at our Membership Options page, or simply start a two-week trial at our sign-up page.

The Bespoke 50 performance chart shown does not represent actual investment results. The Bespoke 50 is updated weekly on Thursday. Performance is based on equally weighting each of the 50 stocks (2% each) and is calculated using each stock’s opening price as of Friday morning each week. Entry prices and exit prices used for stocks that are added or removed from the Bespoke 50 are based on Friday’s opening price. Any potential commissions, brokerage fees, or dividends are not included in the Bespoke 50 performance calculation, but the performance shown is net of a hypothetical annual advisory fee of 0.85%. Performance tracking for the Bespoke 50 and the Russell 3,000 total return index begins on March 5th, 2012 when the Bespoke 50 was first published. Past performance is not a guarantee of future results. The Bespoke 50 is meant to be an idea generator for investors and not a recommendation to buy or sell any specific securities. It is not personalized advice because it in no way takes into account an investor’s individual needs. As always, investors should conduct their own research when buying or selling individual securities. Click here to read our full disclosure on hypothetical performance tracking. Bespoke representatives or wealth management clients may have positions in securities discussed or mentioned in its published content.
Housing Starts and Building Permits Raise the Roof
The latest data on residential housing for the month of February generally came in better than expected today and showed some positive longer-term trends. Starting with the actual numbers, Housing Starts increased 6.8% m/m, and while growth in multi-family units was higher than the headline number, single-family units still showed healthy growth of 5.7%. Building Permits actually showed a modest decline in February, falling 1.9%, but single-family units barely even declined. On a regional basis, despite weaker sentiment from homebuilders in the Northeast in yesterday’s report from the NAHB, both Housing Starts and Building Permits in the Northeast grew more than 20% m/m which was easily the strongest showing of any region.

From a longer-term perspective, the 12-month average of Housing Starts made another post-financial crisis high in February rising to its highest level since March 2007. Typically, this reading starts to roll over well in advance of a recession, so the fact that it’s hitting multi-year highs now should provide some relief to those who are concerned about the flattening of the yield curve.

It isn’t just Housing Starts that are making new highs on a 12-month average basis. The 12-month average of Building Permits also ticked up to the highest level since February 2007.

Finally, the chart below shows the 12-month average of single-family Building Permits and Housing Starts. For much of the last year, the average of single-family units was starting to show signs of rolling over as supply chain issues slowed down activity in the sector. Given housing’s leading nature relative to the business cycle, this was somewhat concerning, even if the issue was more supply rather than demand-driven. February’s report, though, was encouraging in that both Permits and Starts showed increases again in their 12-month averages. Click here to view Bespoke’s premium membership options.

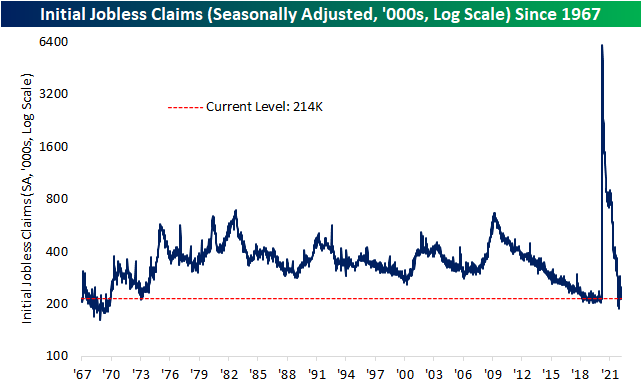
Continuing Claims At the Lowest Level Since 1970
Seasonally adjusted jobless claims continue to ping back and forth within their recent range between 200K and 300K. Still off the sub-200K readings from the end of last year, jobless claims fell from 229K to 214K this week. That is the lowest level since the last week of 2021 when they were 7K lower. Even though there has been no new notable low, the current level is still healthy and consistent with pre-pandemic levels that had not been observed at any other period after the early 1970s.
Jobless claims continue to have seasonal tailwinds at this point of the year and typically do not seasonally bottom until several weeks later. The current week of the year has historically been one of the strongest in terms of consistency of declines in the non-seasonally adjusted number. Since 1967, 92.7% of the time claims have fallen week over week during the current week of the year, and this year was no exception. At 202.9K, it was only slightly above the low of 196K from two weeks ago. That level is also still slightly above the readings for the same week of the year prior to the pandemic (2018 and 2019).

Delayed an additional week making the most recent reading through the first week of March, seasonally adjusted continuing claims fell to a fresh low of 1.419 million. That is the strongest reading on continuing claims since February 1970. Click here to view Bespoke’s premium membership options.

Bespoke’s Morning Lineup – 3/17/22 – Better Than Expected Economic Data
See what’s driving market performance around the world in today’s Morning Lineup. Bespoke’s Morning Lineup is the best way to start your trading day. Read it now by starting a two-week trial to Bespoke Premium. CLICK HERE to learn more and start your trial.
“There are far, far better things ahead than any we leave behind.” – C.S. Lewis
After two strong days, equities are experiencing a bit of a hangover this morning with futures lower across the board. There’s been a lot of discussion concerning the equity market’s wild swings following the announcement, with a sharp sell-off initially followed by a rebound that erased all the original post-FOMC losses. While the Fed’s new projections for rate hikes were more hawkish than its prior forecast, the new numbers were essentially in line with what the market was already pricing in.
Crude, which dropped more than 20% from its recent peak is bouncing back as WTI trades near $100 per barrel, and treasury yields pull back a bit. The 2s10s yield curve continued to flatten overnight, dropping back below 20 bps to new post-COVID lows.
While markets rallied partly on hopes yesterday of a potential ceasefire in Russia, that optimism dried up this morning as the Kremlin says any reports of progress are ‘wrong’.
There’s another busy day of economic data with Housing Starts, Building Permits, Philly Fed, and Jobless Claims all at 8:30, while Industrial Production and Capacity Utilization will be released 15 minutes before the opening bell. The 8:30 reports all came in better than expected, so we’ll see if the 9:15 data can make it a perfect day.
Read today’s Morning Lineup for a recap of all the major market news and events from around the world, including the latest US and international COVID trends.
US stocks have enjoyed quite a rally over the last two trading days. The Nasdaq has rallied more than 2.5% on back-to-back trading days. That’s an impressive streak and isn’t all that common, although we would note that the last back-to-back run of 2.5%+ gains was less than two months ago in late January. Going back to 1996, this week’s streak is just the 27th time the Nasdaq has rallied more than 2.5% on back-to-back trading days, but more often than not, these kinds of rallies have occurred during bear markets.
Of the 27 prior steaks, 11 occurred during the dot-com bust from March 2000 through October 2002, and another four occurred during the financial crisis. Of the remaining 12 occurrences, seven occurred leading up to the March 2000 peak, three occurred between October 2002 and March 2003, and the last two have occurred since the start of 2020.

Start a two-week trial to Bespoke Premium to read today’s full Morning Lineup.