Relative Strength in Dividend Stocks
In 2020 and most of 2021, dividend stocks underperformed the broader S&P 500 as investors put an emphasis on growth due largely to the low-rate environment. Since the Fed pivot to a tightening bias beginning in late 2021, though, there has been a sharp reversal in this trend.
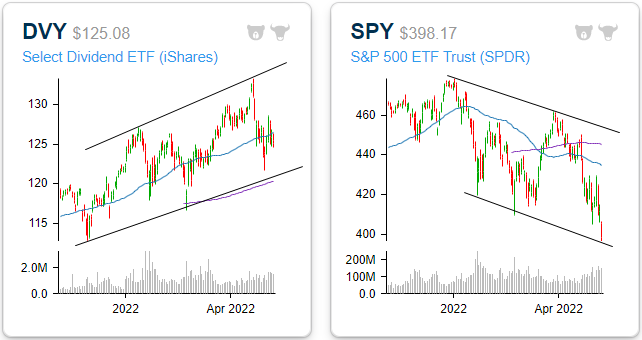
As it currently stands, the iShares Select Dividend ETF (DVY) has made up just about all of its pandemic-era underperformance versus the S&P 500 (SPY). Since the pre-pandemic highs, DVY has gained 16.9% versus a 17.9% advance for SPY, and that doesn’t even include the impact of dividends. After taking into account DVY’s higher yield (3.0 vs 1.6%), it is actually outperforming SPY during this span. Looking more closely at just 2021, DVY has outperformed SPY by 17.7 percentage points (+1.3% vs -16.3%) as investors have exited growth and into more value and income-oriented investments.

Whereas all of the major indices have entered downtrends, DVY is yet to break its uptrend. The ETF is trading well above its 200-DMA but slightly below the 50-DMA. Overall, the technical picture is relatively attractive, especially in comparison to the broader market. The following graphs are accessible through our Chart Scanner tool. Gain access to our proprietary tools by clicking here to view Bespoke’s premium membership options.
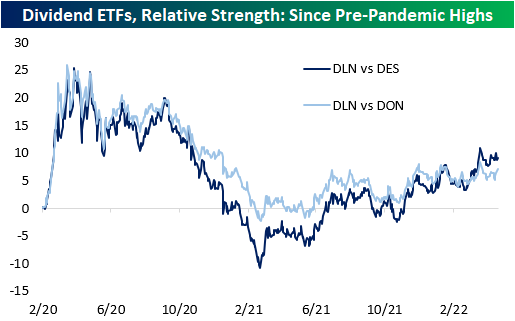
Within the high-dividend space, large caps have outperformed both mid and small caps. The WisdomTree US Large Cap Dividend ETF (DLN), the WisdomTree US Mid Cap Dividend ETF (DON), and the WisdomTree US Small Cap Dividend ETF (DES) were the funds used to compare performance across market caps. As you can see from the chart below, the larger companies that pay hefty dividends have outperformed mid-caps, and mid-caps have outperformed small caps. All three ETFs have similar yields, so the market cap discrepancies are likely more market-related.
While the average S&P 500 stock is down 11.8% on a year-to-date total return basis (median: -14.7%), the 25 highest dividend-paying stocks excluding energy (shown below) are down an average of 8.6% (median: -11.8%). Although this performance is not stellar, the average is still 320 basis points above that of the broader index. Given the recent surge in energy prices over the last year, a number of stocks in the Energy sector have seen their dividend payouts surge. Given the volatile nature of energy prices, the level of these yields may not be sustainable, so for that reason, we have left them out of this specific list.

B.I.G. Tips – Nasdaq 25%+ Haircuts
Chart of the Day: The Day After 3%+ Drops
Bespoke’s Morning Lineup – 5/10/22 – Turnaround?
See what’s driving market performance around the world in today’s Morning Lineup. Bespoke’s Morning Lineup is the best way to start your trading day. Read it now by starting a two-week trial to Bespoke Premium. CLICK HERE to learn more and start your trial.
“It always seems impossible until it’s done.” – Nelson Mandela

Below is a snippet of content from today’s Morning Lineup for Bespoke Premium members. Start a two-week trial to Bespoke Premium now to access the full report.
It’s been a painful three days for US equity investors, and they’re looking to catch a break today as S&P 500 futures are indicating a rally of about 1% at the open. Investors have been fooled enough times this year already by a strong tape at the open, so you can’t fault them for viewing this morning’s rally with a fair amount of skepticism.
Treasuries are also rallying this morning as the 10-year yield is back below 3%. The only economic news on the calendar this morning was the NFIB Small Business Optimism report which was unchanged from March and slightly ahead of expectations.
Over in Europe, economic sentiment came in better than expected whole Industrial Production in Italy managed to come in unchanged versus forecasts for a decline of 1.9%.
In today’s Morning Lineup, we recap the recent developments in stablecoins (pg 4), overnight earnings (pg 5), economic data out of Asia and Europe (pg 6), and a lot more.
After breaking below support to close last week, the bottom fell out of the Nasdaq 100 yesterday as the index dropped to another 52-week low and its lowest level since November 2020.

With the Nasdaq 100 at 52-week lows, we wanted to check in on its valuation and how it looks relative to the S&P 500. The chart below shows the historical premium in the Nasdaq 100’s P/E ratio relative to the S&P 500. For the last ten years, there has never been a point where the Nasdaq 100 traded at a cheaper valuation than the S&P 500, and the average premium during that span has been 23.1%.
Towards the end of 2019, right before COVID, the Nasdaq 100’s premium valuation to the S&P 500 was right in line with its historical average, but that premium exploded higher during COVID reaching as much as 50% in late 2021. Through a combination of earnings growth and rapidly falling stock prices, much of the air has come out of the Nasdaq 100’s premium relative to the S&P 500, but it still remains elevated relative to the historical average.

Start a two-week trial to Bespoke Premium to read today’s full Morning Lineup.
Daily Sector Snapshot — 5/9/22
S&P 500 At 52-Week Lows
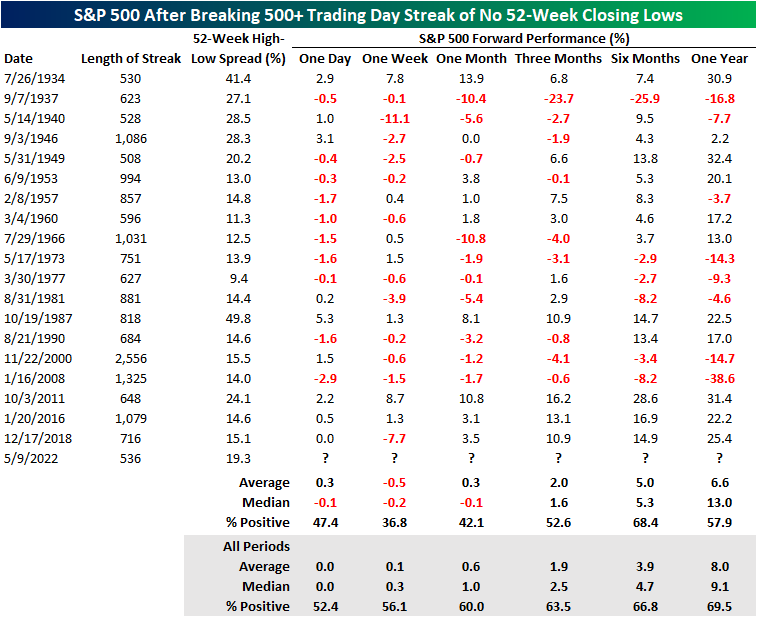
The S&P 500 plummeted more than 3% today and traded at a 52-week low (on a closing basis) for the first time since 3/23/20. This marks the end of a 536 trading day streak in which the S&P 500 did not close at a 52-week low. So, how has the benchmark US index traded following prior days when it closed at a 52-week low? On an average basis, when the S&P 500 closes at a new 52-week low, it averages a gain of 7 basis points the following day and 63 basis points over the following week. In the next month, the S&P 500 averages a gain of 158 basis points.

The streak that ended today was the seventeenth longest on record and the 20th streak where it went at least 500 trading days without a 52-week low. Following the end of prior streaks, near-term forward returns have been quite weak. Over the next week, the S&P 500 averaged a loss of 50 basis points, which is 60 bps less than the average for all periods. Over the following month, the average gain was about half of that of all periods (+0.3% vs +0.6%). Apart from the next six months, positivity rates were also lower across every time period we looked at. In the next year, the S&P 500 averaged a gain of 6.6% (median: 13.0%) versus 8.0% for all periods.
The S&P 500 has only declined by 2%+ to set a new closing 52-week low 24 times (for the first time in twelve months) since 1928. Following these occurrences, the index averaged a decline of 1.3% (median: -0.5%) over the following week, which is 140 basis points below the average of all periods. Over the following month, the S&P 500 averaged a gain of just 20 basis points (median -1.1%), which is again, lower than the average of all periods. Over the following three and six months, average returns were better than average, although median returns were mixed. One year later, the average performance was slightly better than the average for all periods, but the median return was more than twice the historical average. Click here to view Bespoke’s premium membership options.

Chart of the Day: Post-Fed Tumble Reaches Day Three
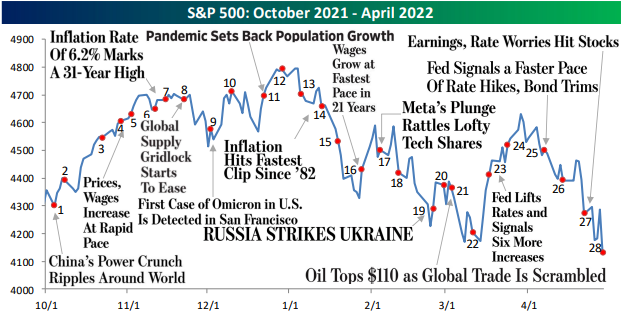
April 2022 Headlines
Bespoke’s Morning Lineup – 5/9/22 – Buyer Strike Continues
See what’s driving market performance around the world in today’s Morning Lineup. Bespoke’s Morning Lineup is the best way to start your trading day. Read it now by starting a two-week trial to Bespoke Premium. CLICK HERE to learn more and start your trial.
“History provides a crucial insight regarding market crises: they are inevitable, painful, and ultimately surmountable.” – Shelby M.C. Davis
Below is a snippet of content from today’s Morning Lineup for Bespoke Premium members. Start a two-week trial to Bespoke Premium now to access the full report.
The post-FOMC hangover has carried through the weekend as foreign equities and now the US are all trading sharply lower to start the week. Higher interest rates, higher inflation, and higher geopolitical tensions remain the key headwinds facing the equity market and fixed income, and they don’t show many signs of abating at this point. The only thing equities have going for them is that every major US index heads into the week at oversold levels.
In today’s Morning Lineup, we recap the shifting sentiment in the tech sector to profits over growth (pg 4), Chinese trade date (pg 6), investor sentiment (pg 6), and a lot more.
With equities poised to open down over 1% this morning, the S&P 500 will be trading right near new lows for the year and right around lows from last April and May. It’s been a while since the S&P 500 has traded at a 52-week low, but that’s a real possibility this morning.

Looking at where sectors stand heading into the week, the snapshot below from our Trend Analyzer shows that last week was a mixed picture for markets. While Real Estate, Consumer Discretionary, and Consumer Staples were all down over 1%, Energy surged over 10%, while Utilities managed to rally over 1%. On a YTD picture, the trend remains the same. YTD it has been basically Energy and everything else.

Start a two-week trial to Bespoke Premium to read today’s full Morning Lineup.
Bespoke Brunch Reads: 5/8/22
Welcome to Bespoke Brunch Reads — a linkfest of the favorite things we read over the past week. The links are mostly market related, but there are some other interesting subjects covered as well. We hope you enjoy the food for thought as a supplement to the research we provide you during the week.
While you’re here, join Bespoke Premium with a 30-day free trial!
Blood In The Streets
Paul Tudor Jones says he can’t think of a worse financial environment for stocks or bonds right now by Yun Li (CNBC)
Macro hedge fund manager Paul Tudor Jones argues that the environment couldn’t get much worse, which at least has the ring of a contrarian opportunity…after all, if things can’t get worse, next they have to get better. [Link]
The Popping of the Bubble Stocks: An Update by Ray Dalio (LinkedIn)
Bridgewater’s Dalio declares a bubble in US equities has popped, but isn’t optimistic about the path forward for the market from here. [Link]
Tiger is suffering one of the biggest hedge fund drawdowns in history by Robin Wigglesworth (FTAV)
Massive tech hedge fund Tiger has been cut nearly in half this year as tech and growth stocks that it tends to hold get uniquely crushed. It’s unclear whether the fund can weather declines these large and remain a going concern. [Link; registration required]
Stocks and Bonds Are Falling in Lockstep at Pace Unseen in Decades by Gunjan Banerji (WSJ)
The combined drop in stocks and bonds isn’t unprecedented, but it’s highly unusual and it is extreme, putting pressure on investors across markets for it’s unusual one-two hit to brokerage balances and retirement accounts. [Link; paywall]
Citi acknowledges trading error after flash fall in some European shares by Joshua Franklin and Philip Stafford (FT)
A human error by a Citibank trader led to an 8% collapse in benchmark Swedish equity index on Monday; the drop didn’t last long despite the “bungled” execution on a basket of shares Citi was trading for a client. [Link; paywall]
Blue Bird
‘I Don’t Really Have a Business Plan’: How Elon Musk Wings It by Ryan Mac, Cade Metz and Kate Conger (NYT)
An inside look at the aggressive and free-wheeling world that Elon Musk inhabits, with little negative feedback and lots of micromanagement. [Link; soft paywall]
Investment Management
Wells Fargo Accidentally Kills Off FA in Letter to Clients by James Rogers (Financial Advisor IQ)
After an advisor left Wells Fargo’s wirehouse for an affiliate of Kestra Financial, WFC accidentally sent out a letter to his clients announcing his death. [Link]
Fidelity to Allow Retirement Savers to Put Bitcoin in 401(k) Accounts by Anne Tergesen (WSJ)
The 401k giant will soon allow investors to allocate retirement funds to bitcoin, opening the tax-advantaged investment accounts of employees at more than 20,000 companies to the crypto markets. [Link; paywall]
This $500 Billion Private Club for Family Offices Is Booming by Benjamin Stupples (Bloomberg)
As the number of family offices bloom, they’re starting to share information and education via an informal club that hosts regular events for its 250 members representing AUM of nearly half a trillion dollars. [Link; soft paywall]
Slowing Demand
Former Fed Vice Chair Quarles Says U.S. Is Likely to Suffer Recession by Rich Miller (Bloomberg)
After being ousted from the Fed when his term on the FOMC was complete, former Vice Chair for Supervision Randall Quarles thinks the Fed will need to hike so much that a recession will take place. [Link; soft paywall]
Americans Are Showing Inflation Fatigue, and Some Companies See a Breaking Point by Sharon Terlep (WSJ)
After spending two years busily buying everything they could get their hands on, American consumers are starting to balk at some of the prices that they’re being charged for discretionary items. [Link; paywall]
A third of small retailers can’t pay rent as financial struggles spike again by Ben Unglesbee (Retail Dive)
One in three smaller retailers are unable to cover their rent, with almost half saying their rent has risen over the next six months; smaller retailers aren’t able to absorb costs and pass on price hikes as well as larger retailers. [Link]
Shaky Lending
Used-Car Dealer Debuts Subprime Auto Bond Even as Sector Weakens by Adam Tempkin and Charles E Williams (Bloomberg)
Car-Mart, a used auto retailer targeting subprime quality buyers, priced an ABS backed by lower-quality loans yesterday and was able to sell them despite a steep concession demanded by investors. [Link; soft paywall]
‘Buy now, pay later’ is sending the TikTok generation spiraling into debt, popularized by San Francisco tech firms by Joshua Bote (SFGate)
Buy now, pay later (BNPL) is a way to take on debt at a potentially lower cost than credit cards. But 91% of consumer loans in California from 2020 were BNPL loans, and the seductive nature of the loans which lower the upfront cost of paying for big ticket items is starting to prove a challenge for some borrowers. [Link]
Data Privacy
CDC Tracked Millions of Phones to See If Americans Followed COVID Lockdown Orders by Joseph Cox (Vice)
CDC policymakers used anonymized location data to see how the public responded to curfews and other activity restrictions. While there is no evidence the CDC misused the data, FOIA requests reveal significant potential privacy concerns from the project. [Link]
Google lines up with Apple and Microsoft to nix passwords in favor of nearby-device authentication by Rob Pegoraro (Fast Company)
Major device and software companies are moving towards an open architecture that relies on identify verification on a smartphone in order to access other systems like laptops or PCs. [Link]
Location, Location, Location
$1-million milestone: Orange County median home price hits seven figures. by Andew Khouri (MSN/LAT)
Orange County is a sprawling Southern California polity with a diverse population, but housing has rapidly spiraled out of reach: the median home price has topped $1mm, a 22% jump versus a year ago. [Link]
I-Team: Body found in barrel in Lake Mead may date back to 1980s, more likely to appear as water recedes, Las Vegas police say by David Charns (8NewsNow)
A murder victim who was stuffed into a barrel in the 1980s was discovered in Lake Mead recently; authorities expect more such remains to emerge as brutal drought lowers the lake’s level. [Link]
Ball Games
What the heck is going on with the baseball? Everything you need to know about MLB’s scoring drought (ESPN)
Offense as measured by both batting average and scoring is among the lowest in league history to start this season as home runs disappear thanks to an intentional set of changes to the ball itself which may have gone further than expected. [Link; auto-playing video]
Read Bespoke’s most actionable market research by joining Bespoke Premium today! Get started here.
Have a great weekend!