Charts of the Week from Bespoke — 7/22/22
Below are some of our favorite charts from our work this week. Try Bespoke’s premium research service today to receive our unique stock market charts and analysis in your inbox daily. Click here to start a one-month trial now!
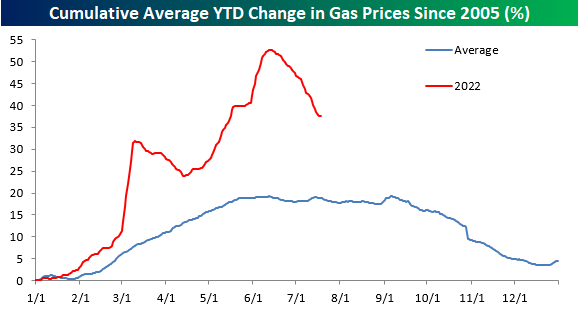
We started the week noting the steep drop in gas prices that we’ve seen from highs made in mid-June. While gas prices are indeed down, they’re still up much more than usual year-to-date. From a seasonal perspective, this is normally a time of year when gas prices are trending lower, so this year’s drop is not out of the norm. In the chart below, the red line shows this year’s change in gas prices, while the blue line shows the average pattern that gas prices have taken throughout the year going back to 2005.
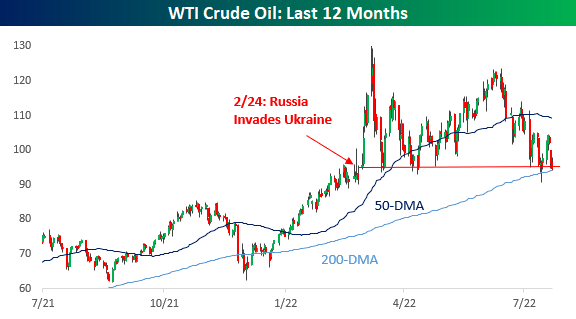
Gas prices are of course driven by the price of crude oil, and in Friday’s Morning Lineup, we noted that crude oil prices have now fallen back to the level they were at when Russia launched its invasion of Ukraine back in late February:
On Wednesday we wrote about weekly mortgage data that continues to show steep drops in activity. As shown below, with mortgage rates rising sharply to levels not seen in more than a decade this year, refinancing activity has fallen to its lowest level since November 2000!

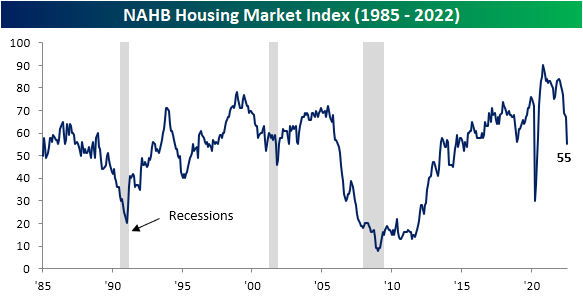
Less activity and much higher costs have caused homebuilders to sour on housing. As we noted in a post on Monday and as shown below, the NAHB’s housing market sentiment index has fallen sharply in recent months to its lowest level since May 2020 just after the pandemic began.
There’s plenty of negative sentiment to go around throughout both the economy and the investment community. In our weekly post on investor sentiment, we highlighted the chart below that shows streaks of weeks where there have been more bears than bulls in the weekly American Association of Individual Investors survey. At 16 consecutive weeks, this is the third longest streak over the past 35 years!

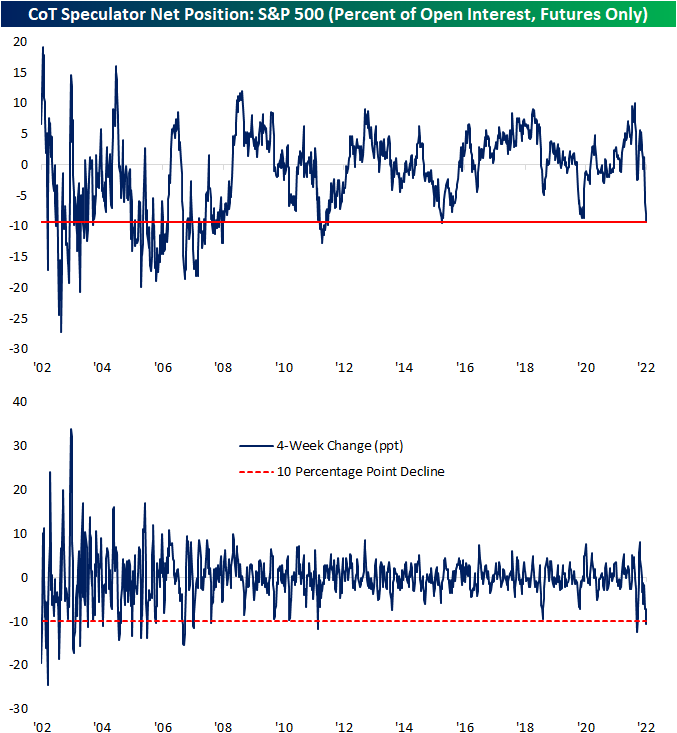
We publish detailed analysis of the CFTC’s weekly Commitment of Traders report in our Closer report every Monday (the Closer is only available to Bespoke Institutional subscribers). The Commitment of Traders report shows how long or short futures traders are on various asset classes based on their positions in the futures market. As shown below, speculator positioning recently turned extremely bearish on the S&P 500. These types of indicators are typically viewed from a contrarian lens, but you can read more about this specific indicator in our blog post from earlier in the week.
In good news, the “prices paid” component of this month’s Philadelphia Fed Manufacturing survey saw another sharp drop for July. While it’s still elevated, this inflation reading has fallen sharply since peaking in April, and signs that inflation has peaked are a key reason why stocks have managed to bounce a bit over the last month or so. You can read more about this month’s Philly Fed report in our post on the subject from Thursday.

Our Morning Lineup is one of our most popular reports for subscribers. We’re biased, but we think it’s the best daily pre-market report in existence! (See for yourself with a one-month Bespoke Premium trial.) The chart below was highlighted in our Morning Lineup on Wednesday after the Nasdaq ended a streak of over 60 trading days below its 50-day moving average. Since the Nasdaq was created in the early 1970s, there have only been 18 other streaks of 60 or more trading days below the 50-DMA. It’s not common, but at least it’s over!

As we close out another hot summer trading week, below is a look at where key US index ETFs stand in their “trading ranges” after the recent surge we’ve seen for stocks. Usually, after an ETF sees a gain of more than 5% in a one-week span, it’s trading well into “overbought” territory. But given how depressed the US stock market had gotten heading into July, most of the index ETFs we follow are still trading in “neutral” territory.
Bespoke Premium and Institutional subscribers can use our interactive Trend Analyzer tool that looks similar to the graphic below. It’s helpful for monitoring indices, sectors, stocks, baskets of stocks, and custom portfolios. We also cover the concept of “overbought” and “oversold” in our work regularly, so if you’d like to learn more about how we monitor price movements, start a one-month Premium trial today!
Later today we’ll be sending subscribers our weekly Bespoke Report newsletter, so be on the lookout for that in your inbox if you’ve already signed up for your trial. We hope you have a great weekend!

Bespoke’s Morning Lineup – 7/22/22 – The Calm Before the Storm
See what’s driving market performance around the world in today’s Morning Lineup. Bespoke’s Morning Lineup is the best way to start your trading day. Read it now by starting a two-week trial to Bespoke Premium. CLICK HERE to learn more and start your trial.
“The impossible could not have happened, therefore the impossible must be possible in spite of appearances.” – Agatha Christie

Below is a snippet of content from today’s Morning Lineup for Bespoke Premium members. Start a two-week trial to Bespoke Premium now to access the full report.
Major US equities are heading into the last day before the weekend holding strong gains for the week. In addition to breaking above their respective 50-day moving averages, the S&P 500 is up 3.5% week to date while the Nasdaq is up over 5%. Futures for both indices are modestly lower this morning, but it could have been worse given some of the weak tech earnings since the close yesterday. Outside of equities, crude oil is lower while US Treasury yields are plunging with the 10-year yield down to 2.8% and the 3m10y treasury yield curve down to just 35 basis points (bps). It’s not inverted yet, but it’s moving quickly in that direction.
Things are pretty quiet given the Summer Friday, but enjoy the calm while it lasts. With earnings season ramping up next week, including reports from the four largest companies in the S&P 500, things could get rocky.
Today’s Morning Lineup discusses earnings news out of Europe and the US, the latest ECB decision, events in the Ukraine and Italy, and economic data from around the world including UK home prices and weekly US mortgage application data.
Crude oil is trading down over 1.5% this morning putting it on pace for the third straight day of declines of over 1%. That would be the longest streak of 1%+ daily declines since mid-March. As we type this, WTI is barely trading above its 200-DMA which is a level it has not closed below since last December. Current levels also coincide with where it was trading right before Putin invaded Ukraine back in late February. After briefly surging above $130 per barrel right after the invasion, crude oil has now declined nearly 28% from that peak. Look for these declines to start showing up in the monthly inflation numbers in the months ahead.

Energy stocks live and die by the price of oil (and natural gas), so it should come as no surprise that with crude oil down by over a quarter and natural gas still down from its early June high (although it has rallied sharply in the last two weeks), energy stocks have been under pressure. After peaking above $90 in early June, the Energy Select Sector SPDR (XLE) has pulled back more than 20%, and like WTI, is trading just above its 200-DMA and right around levels it was trading at prior to the Russian invasion of Ukraine. For both energy commodities and the stocks in the sector, their future direction will depend on the push of geo-political tensions and supply concerns versus the pull of increasingly weaker economic growth.

Start a two-week trial to Bespoke Premium to read today’s full Morning Lineup.
Bespoke’s Weekly Sector Snapshot — 7/21/22
The Bespoke 50 Growth Stocks — 7/21/22
The “Bespoke 50” is a basket of noteworthy growth stocks in the Russell 3,000. To make the list, a stock must have strong earnings growth prospects along with an attractive price chart based on Bespoke’s analysis. The Bespoke 50 is updated weekly on Thursday unless otherwise noted. There were no changes to the list this week.
The Bespoke 50 is available with a Bespoke Premium subscription or a Bespoke Institutional subscription. You can learn more about our subscription offerings at our Membership Options page, or simply start a two-week trial at our sign-up page.

The Bespoke 50 performance chart shown does not represent actual investment results. The Bespoke 50 is updated weekly on Thursday. Performance is based on equally weighting each of the 50 stocks (2% each) and is calculated using each stock’s opening price as of Friday morning each week. Entry prices and exit prices used for stocks that are added or removed from the Bespoke 50 are based on Friday’s opening price. Any potential commissions, brokerage fees, or dividends are not included in the Bespoke 50 performance calculation, but the performance shown is net of a hypothetical annual advisory fee of 0.85%. Performance tracking for the Bespoke 50 and the Russell 3,000 total return index begins on March 5th, 2012 when the Bespoke 50 was first published. Past performance is not a guarantee of future results. The Bespoke 50 is meant to be an idea generator for investors and not a recommendation to buy or sell any specific securities. It is not personalized advice because it in no way takes into account an investor’s individual needs. As always, investors should conduct their own research when buying or selling individual securities. Click here to read our full disclosure on hypothetical performance tracking. Bespoke representatives or wealth management clients may have positions in securities discussed or mentioned in its published content.
Philly Fed Collapsing
Tacking on to the list of weaker than expected US economic releases this morning was a big drop in the Philadelphia Fed’s Manufacturing Business Outlook Survey. After a contractionary -3.3 reading last month, forecasts were calling for the headline number to rise back into expansion. Instead, it posted an even larger decline down to -12.3; the lowest reading since May 2020. Expectations have been even worse. That month-over-month decline in July ranked in the bottom decile of all monthly moves in the history of the survey dating back to 1968. Even more depressing, the low level reached is the worst reading since December 1979.

Given the huge drop in the headline index, breadth left much to be desired this month. The categories are almost evenly split between those in contraction and expansion while there is also a wide dispersion between where each category stands relative to their respective ranges. For example, while New Orders has become very depressed – only in the 3rd percentile of all months after the double digit month over month decline in July – the index for Number of Employees has held up relatively well in the 93rd percentile. The whole of the report paints a fairly dour outlook for the region’s manufacturing economy, but expectations are broadly weaker than current conditions with multiple categories reaching new record lows.

As previously mentioned, New Orders is the weakest current conditions index. The reading fell from -12.4 to -24.8 in the past month. Prior to the spring of 2020, the last time this index was as low was during the Global Financial Crisis era. Expectations are even worse. Last month’s decline was much more severe at 23.5 points versus 5 points in July, however, the continued drop has brought the index to the lowest level since September 1979. Although demand has slumped, Shipments actually accelerated with the current conditions index slightly below median while expectations saw a large 9.2 point MoM jump. Unfilled Orders expectations similarly moved higher versus last month but that was only a more modest bounce as the index remains in the bottom 1% of all months. Current Conditions are more modestly in contraction in the 27th percentile after falling another 3.4 points in July.

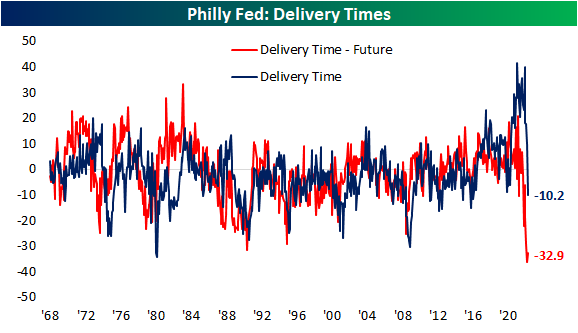
One of the most striking changes over the past few months has been in regards to supply chains. Higher readings in the Delivery Times index indicate that manufacturers are seeing products taking longer to reach their destinations and vice versa for lower readings. Throughout the pandemic, this index sat at unprecedentedly high levels. All of that has been reversed now, though, as Delivery Times moved from expansion into contraction. Not only are delivery times now falling, but the July reading was the lowest reading since May 2016. In other words, on net, a larger share of respondents are seeing declines rather than increases in how long it takes for products to be delivered. Meanwhile, expectations are at the extreme low end of their historical range, coming slightly off last month’s record low. All that is to say supply chains are seeing massive improvements to stress as demand rapidly cools.
Prices have also been experiencing a sharp reversal with Prices Paid at the lowest level since January of last year and Prices Received at the lowest level since last March. Click here to learn more about Bespoke’s premium stock market research service.

Third Longest Streak of Negative Bull-Bear Spread on Record
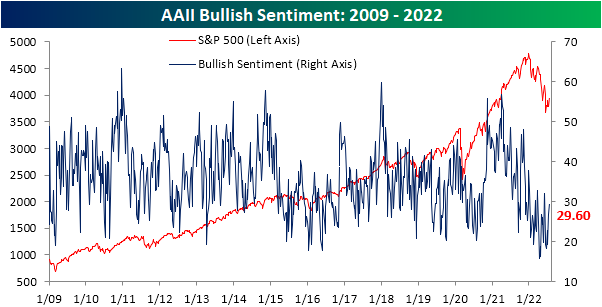
Last week, over a quarter of respondents to the AAII sentiment survey reported bullish sentiment for the first time in over a month. As the S&P 500 has made a considerable move to the upside, bulls have continued to come back this week rising to 29.6%. The percentage of respondents reporting as optimistic has now come back within one standard deviation of its historical average and is at the highest level since the first week of June.
Bearish sentiment has fallen in lockstep with the increase in bullish sentiment. After coming in at over 50% two weeks ago, the reading has shed 10.6 percentage points. Albeit improved, bearish sentiment remains well above the historical average and the double-digit two-week decline is actually the seventh of the year. In other words, the sharp drop in bearish sentiment is not exactly unusual compared to other moves this year as it still has further to go until it reaches a more “normal” level.

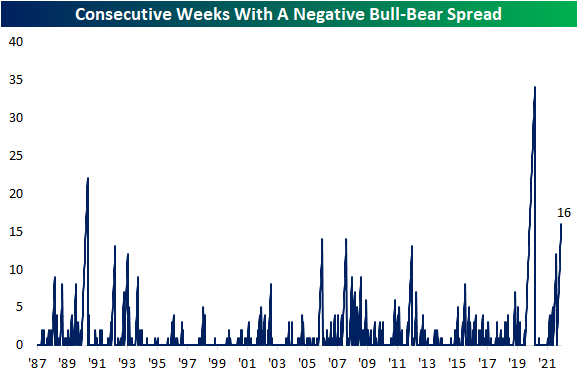
Regardless, with inverse moves in bulls and bears the bull-bear spread has risen to -12.6. That is the highest reading since the first week of June and, as shown in the second chart below, the 16th consecutive week with bears outnumbering bulls. Clearing two other streaks from the early 2000s, that is now the third longest streak on record behind the 22 and 34-week-long streaks ending in December 1990 and October 2020, respectively.

Not all of the losses to bears went to bulls. Neutral sentiment also rose this week rising to 28.2% from 26.6% last week. That is the highest level in three weeks as neutral sentiment has generally been less volatile than bulls and bears recently. Click here to learn more about Bespoke’s premium stock market research service.

Claims Rise With Single State Surges
Jobless claims have undergone further deterioration in the latest week’s data as the seasonally adjusted number topped 250K for the first time since November, and it has now been over four months since the cycle low. As we discussed in a B.I.G. Tips report earlier, that streak without a new low in claims is not particularly long from a historical standpoint, but it is notable when taking into account past increases in claims prior to recessions. While last week’s reading went unrevised, this week’s reading rose 7K to 251K which is 85K above the early April low.

On a non-seasonally adjusted basis, claims were also higher rising 7.9K to 249K. As we have frequently noted, while adjusting for seasonality claims have reversed trend and have been moving higher during a time of year when they typically rise. Historically, last week would have marked the high, although, that has not always been the case. For example, in 2010 and 2011, and potentially again this year, the seasonal high came during the current week of the year instead. In other words, the continued move higher in claims this week on a non-seasonally adjusted basis is somewhat unusual but not without precedent. While that increase could be on account of residual seasonality, it is hard to parse if it is also potentially on account of the material worsening in claims.

Delayed an additional week to the initial claims number, seasonally adjusted continuing claims jumped 51K this week. While that is not exactly a massive jump, bringing claims only to the highest level since April, the week-over-week increase was the largest uptick since late November.

Below we provide a state-level breakdown of the initial and continuing claims numbers (both non-seasonally adjusted). While there are likely some seasonal factors playing into week-to-week movements, this week there were two unusual moves weighing on the national number. Whereas the net national move in claims was an increase of 7.8K, Massachusetts saw a move nearly double the size of that national change. That state’s initial claims went from under 9K all the way up to 23K; the ninth largest weekly increase on record going back to 1986. While less remarkable of a move but also ranking in the top decile of all periods, South Carolina also saw a peculiar increase with claims more than doubling. While these readings could very well be genuine, we would caution that given their outlier nature, a revision down the road is possible, and that would make this week’s release look somewhat better after revisions than it does today. That being said, revisions likely would not be enough to alter the overall national trend in recent months. Click here to learn more about Bespoke’s premium stock market research service.
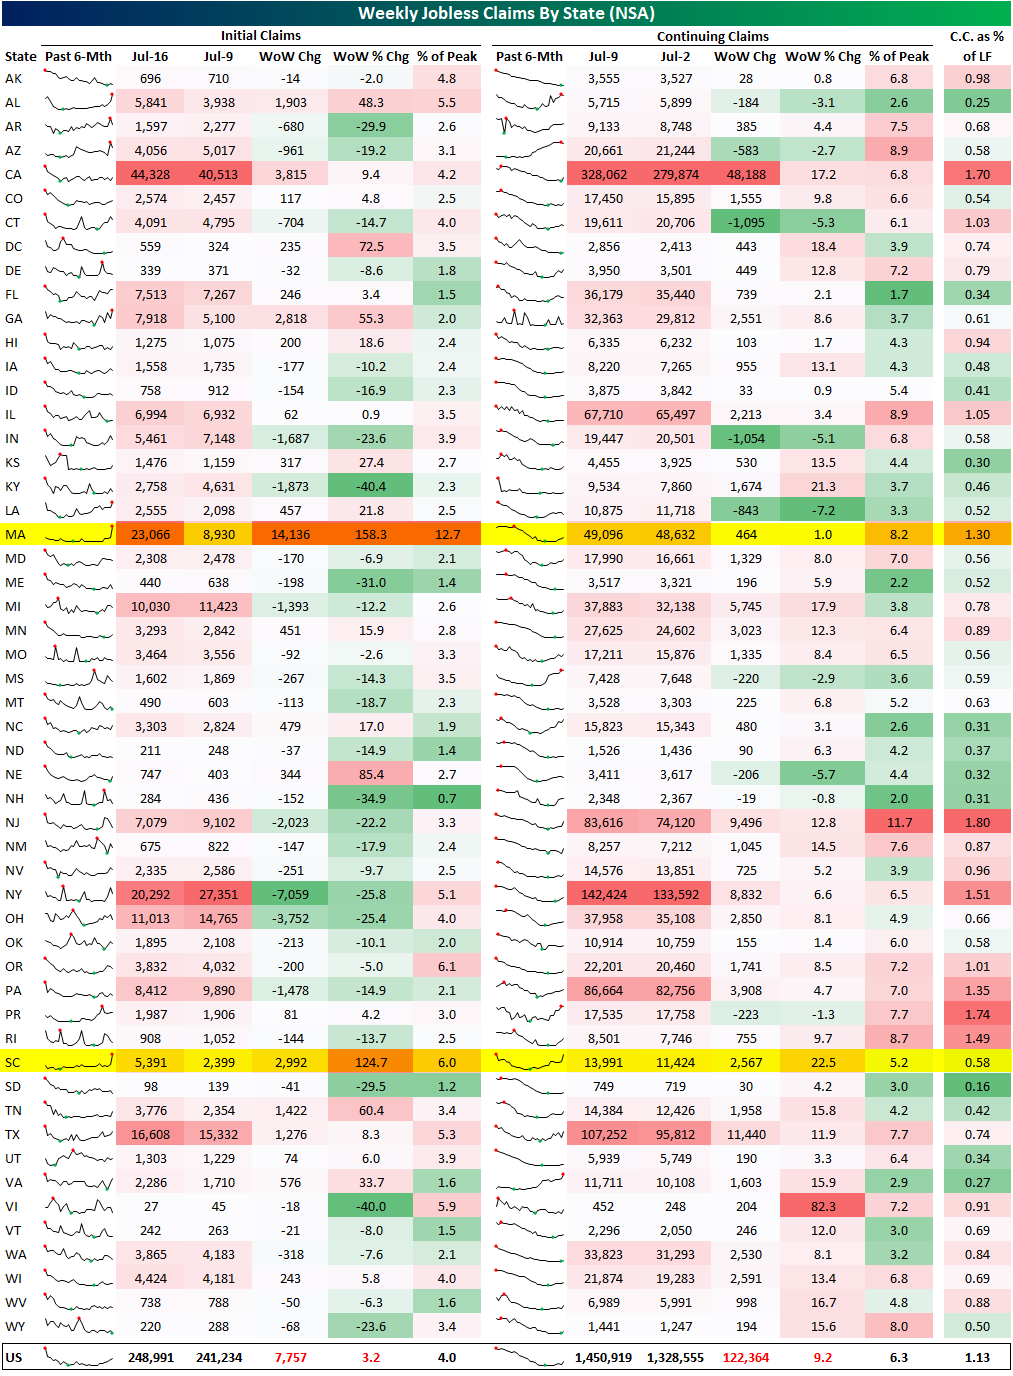
Chart of the Day: Historic Downtrend For Bitcoin Ends
B.I.G. Tips – Jobless Claims Drift Above 250K
Bespoke’s Morning Lineup – 7/21/22 – Another Bull Run Battle
See what’s driving market performance around the world in today’s Morning Lineup. Bespoke’s Morning Lineup is the best way to start your trading day. Read it now by starting a two-week trial to Bespoke Premium. CLICK HERE to learn more and start your trial.
“I like liquor — its taste and its effects — and that is just the reason why I never drink it.” – Stonewall Jackson
Below is a snippet of content from today’s Morning Lineup for Bespoke Premium members. Start a two-week trial to Bespoke Premium now to access the full report.
On this anniversary of the battle of Bull Run, the first major conflict of the Civil War, and as bulls wage another battle against the bear market trend, the above quote from Stonewall Jackson seems applicable. As investors and/or traders, it’s always important to recognize your weaknesses and take steps to avoid them. Those who tend to overtrade or get emotional in reaction to market headlines should take a step back and keep things in perspective. Earnings season is a time of heightened volatility where each major earnings report tends to get extrapolated to the broader economy until the next earnings report sends a different contradictory message.
The market has strung a number of good days together as bank stocks have rallied in reaction to their reports kicking the earnings season off on a positive note. Overall, results have generally been better than expected which has been a good sign. Next week, we’ll get into the heart of earnings season; not only will the pace of reports pick up, but we’ll also hear from the largest companies in the market.
This morning’s market tone is biased to the downside as all the major US averages are indicated to open flat to modestly lower, but there has been some volatility following news of the ECB’s 50 bps rate hike (hinted at earlier this week) hitting the tape. The big move has been in crude oil which is trading down over 4% and near its lowest levels since the first quarter as supplies from Libya ramp up and Russia has resumed the supply of natural gas on the Nord Stream pipeline. On the economic front, it’s a busy day for data with Jobless Claims and the Philly Fed report at 8:30 eastern and leading indicators at 10.
Today’s Morning Lineup discusses earnings news out of Europe and the US, the latest ECB decision, events in the Ukraine and Italy, and economic data from around the world including UK home prices and weekly US mortgage application data.
The rally we have seen in stocks over the last week has been a textbook example of risk-on. Take a look at sector performance below. Besides cyclical sectors leading while defensives have lagged, outside of the Energy sector, the leading sectors over the last week (Consumer Discretionary, Technology, and Communication Services) are also the ones down the most YTD. Conversely, sectors that have declined or seen the smallest gains over the last week have all outperformed YTD. On the topic of energy, while it has been a leader over the last week, today’s 4.5% decline in crude has the sector trading down 2.5% in the pre-market.

Start a two-week trial to Bespoke Premium to read today’s full Morning Lineup.