Bespoke’s Morning Lineup – 7/20/22 – To The Moon
See what’s driving market performance around the world in today’s Morning Lineup. Bespoke’s Morning Lineup is the best way to start your trading day. Read it now by starting a two-week trial to Bespoke Premium. CLICK HERE to learn more and start your trial.
“The single observation I would offer for your consideration is that some things are beyond your control.” – Neil Armstrong

Below is a snippet of content from today’s Morning Lineup for Bespoke Premium members. Start a two-week trial to Bespoke Premium now to access the full report.
It was over 50-years ago today that Neil Armstrong became the first human to walk on the moon. Stocks didn’t go into orbit yesterday, but the S&P 500 and Nasdaq did manage to finally break back above their 50-day moving averages, ending, for the S&P 500, what was the longest streak since the Financial Crisis. This morning, the tone is much more subdued as futures have given up earlier gains as investors digest the latest batch of earnings. On the economic calendar, the only report of note is Existing Home Sales, which is expected to show a modest decline relative to last month.
Today’s Morning Lineup discusses earnings news out of Europe and the US, major earnings reports, and economic data from around the world including UK home prices and weekly US mortgage application data.
Both the S&P 500 and Nasdaq broke some extended streaks of trading below their 50-DMAs yesterday. For the S&P 500, the streak ending at 60 trading days was the longest since the 72-day streak ending all the way back in 2008, and it was just the 19th streak of 60 or more trading days in the post-WWII period. Now the S&P 500 just needs to work up enough strength to get back to its 200-DMA which is still 10.7% above yesterday’s close.

The Nasdaq’s streak of closes below its 50-DMA was even longer at 68 trading days, although that was only the longest streak of closes below that level since the 69-day streak ending in January 2019. Before that you have to go back to the 72 trading day streak ending in December 2008 to find a longer streak. In the Nasdaq’s history dating back to 1971 there have now only been 15 streaks where the index traded below its 50-DMA for 60 or more trading days. Finally, while the S&P 500 is 10.2% below its 200-DMA, the Nasdaq is much further in the hole at 17.2% below its 200-DMA.

Start a two-week trial to Bespoke Premium to read today’s full Morning Lineup.
Daily Sector Snapshot — 7/19/22
Speculators Head for the Hills
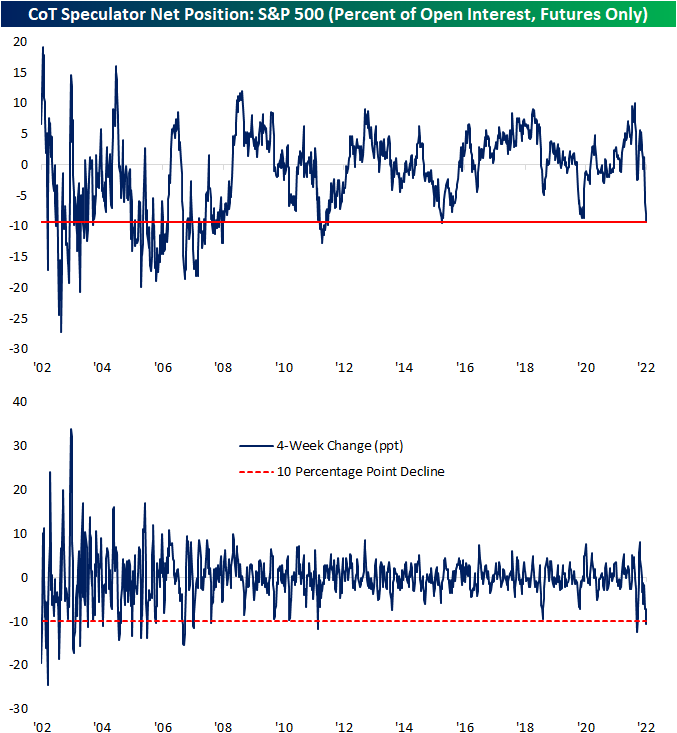
As we do each Monday in our Closer report, we reviewed the latest data from Friday’s release of the CFTC’s Commitments of Traders (CoT) Report. This data shows how speculators are positioned in various assets based on positions in the various futures contracts. One asset that has seen some of the most notable changes of the report in recent weeks has been the S&P 500. As recently as one month ago, that data showed a net 1.29% of open interest was positioned long. Even though the S&P 500 has managed to come off the lows in the past month, positioning has collapsed with a massive move lower meaning there are far more speculators positioned short than long.
Whereas one month ago the reading was net long, in the latest data as of last Tuesday a net 9.3% of open interest was short. That made for the lowest reading since October 2015. In other words, speculators are positioned more pessimistically now than they were during the COVID crash, during the late 2018 near bear market, or any other time over the past several years. The change in positioning has also been rapid. As shown in the second chart below, that net positioning reading has fallen over 10 percentage points in just 4 weeks. Earlier this year in March there was an even larger 12.5 percentage point decline but prior to that, looking back through the history of this data, such large moves have been much rarer over the past decade than was the case in the 2000s and before. In fact, prior to this year the last time positioning in S&P 500 futures fell double digits in four weeks was all the way back in August 2011. On the other hand, the early 2000s frequently saw moves of this size if not larger.
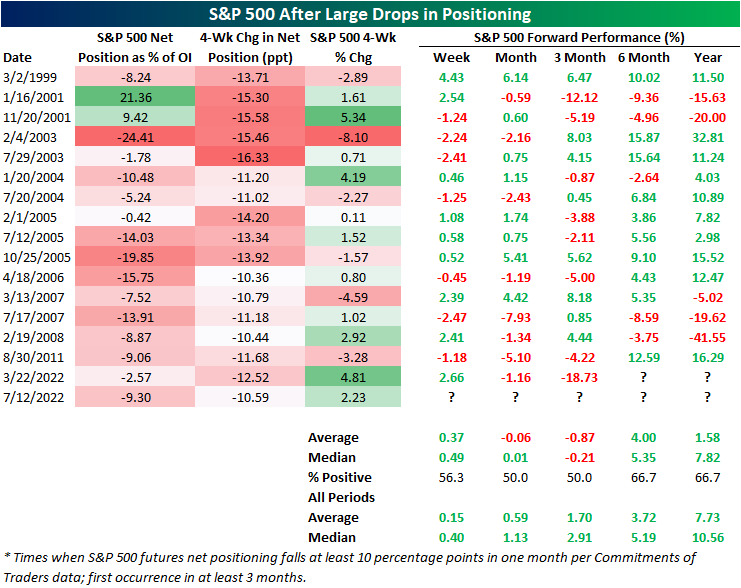
Typically, sentiment data is considered contrarian in nature. In other words, pessimistic sentiment readings are followed by stronger forward performance of equities and vice versa. That has not exactly been the case for this CoT positioning data. Following past declines of at least 10 percentage points, returns have been mixed.
After declines of similar magnitude, the S&P 500 has experienced modest outperformance over the next week. One and three months out, however, have tended to be weaker with postive returns only half the time with negative returns on an average basis. Over the next month, each of the past four instances have been followed by declines.
Six and twelve months out have seen the S&P 500 higher two-thirds of the time, but average and median returns are not significantly better relative to all periods. Click here to learn more about Bespoke’s premium stock market research service.
Goldman and Citi Rip
Following earnings in recent days, both Goldman Sachs (GS) and Citigroup (C) have seen their stocks rip higher, resulting in rarely seen price moves for the stocks. Goldman’s trading segment benefited from increased trading volumes in FX, rate, and commodity markets, helping to fuel a beat on the top and bottom line. C also reported a top and bottom line beat, and every segment saw revenue rise y/y. Click here to view an in-depth analysis of these two earnings reports. Click here to learn more about Bespoke’s premium stock market research service.
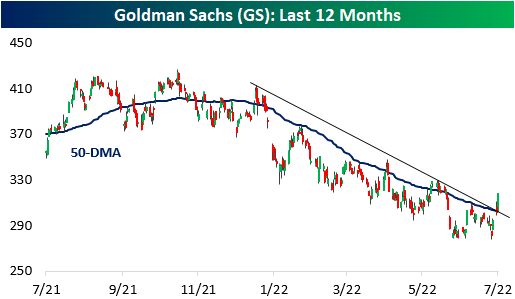
Since the close on July 14th (three trading days ago), GS has ripped 12.5% higher which is the largest three-day rally since May 2020. On its earnings reaction day (7/18), the stock gapped up over four percent but finished the day with a gain of 2.6%. Today, GS jumped an additional 5.5% higher. Notably, the stock has now broken its downtrend and its 50-day moving average, a bullish technical sign for the stock. However, the stock is still down close to 20% on the year, which is worse than the performance of the broader financial sector ETF (XLF).
Following three-day gains of over 12% for GS (for the first time in at least a month), the stock has underperformed its all-period performance on a median basis across each time period we looked at (one day, one week, one month, and three months). Positivity rates are lower as well, so it’s hard to view this occurrence as an overly optimistic signal. One data point to take note of is that the average absolute three-month change is significantly elevated at 20.5% (median: 21.6%). For all periods since its IPO, the average absolute three month price change has been 12.9% (median: 10.1%). If the historical pattern holds, this would suggest that the next three months for the stock will be more volatile than normal. Click here to learn more about Bespoke’s premium stock market research service.

Citi’s chart looks quite similar, and its rally has been even more impressive than the rally in GS as the stock also broke above both the 50-DMA and the downtrend that has been in place since early January. With a gain of 17%, the stock has seen its largest three-day rally since the days coming off the COVID lows in March 2020. Both stocks have also struggled to definitively break through the 50-DMA, so investors should watch these levels carefully over the next few trading sessions. For both stocks, the 50-DMA is still moving lower, but the performance over the last few trading sessions certainly helps the technical picture.

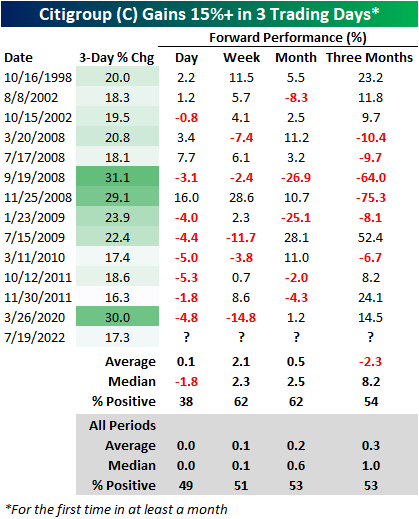
In terms of forward returns, C has had mixed performance following prior three-day gains of at least 17.0%. The table below shows all prior occurrences since the October 1998 merger between Travelers and Citigroup. Of the thirteen prior occurrences, C’s median next-day performance has been a loss of 1.8%, but the stock has booked a median gain of 2.3% over the following week. Over the next three months, C underperforms all periods on an average basis but significantly outperformed on a median basis, and positivity rates have been narrowly above that of all periods. Three months out, C has averaged an absolute move of 24.5% (median: 11.8%), which like GS, is much higher than the 13.2% (median: 9.1%) average absolute three-month change for all periods. Long story short, although the technical picture has improved for both GS and C, investors should continue to expect volatility ahead.
Bespoke Stock Scores — 7/19/22
Chart of the Day: When Laggards Lead
Bitcoin to Ethereum Ratio in Freefall
Risk assets have found some stability in the past month, but one asset that has been absolutely flying higher in Ethereum. The past week’s rally has risen to a remarkable 51% for the world’s second largest crypto bringing its market cap up from $126 billion to $187 billion. In that same span, Bitcoin has only gained 15.5%. After those moves, Bitcoin has returned to its 50-DMA while Ethereum has surged through the line.

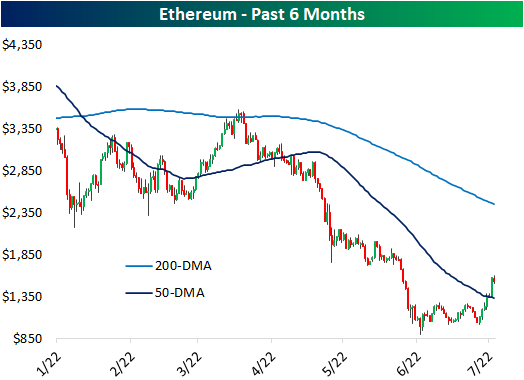
Given that massive outperformance of Ethereum, the ratio of Bitcoin to Ethereum has collapsed. In fact, the ratio has now fallen for seven days in a row, tying three other streaks (September 2019, February 2020, and April of this year) for the longest streaks of consecutive days of declines.

The ratio has fallen considerably as well as consistently in the past week. Exactly one week ago, the ratio hit a near term high and has dropped 23.5% since then. As shown above, that brings the ratio down to the rough uptrend line that has been in place since late last year. Since the start of our price data for Ethereum in November 2017, there have only been a handful of other periods in which this ratio has fallen as sharply; meaning times when there has been similar underperformance of Bitcoin relative to Ethereum. The most recent of these was a little over a year ago in May 2021.

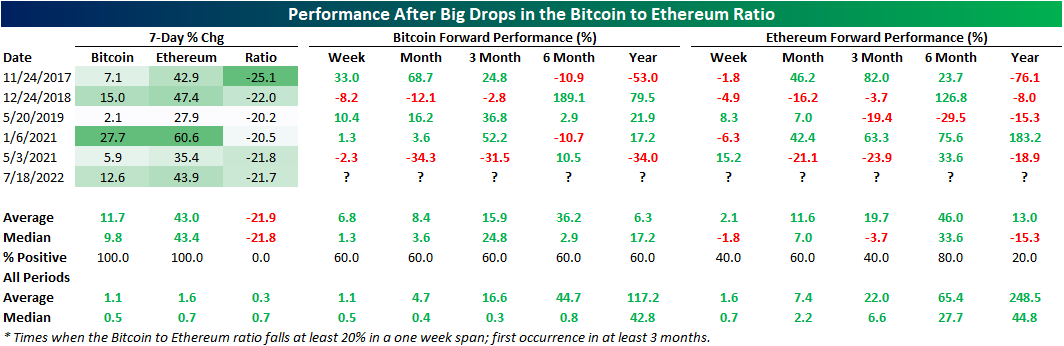
Below we show the performance of Bitcoin and Ethereum during each one of those one week declines of at least 20% in the ratio without another occurrence in the prior three months. This most recent drop in the ratio is only the sixth time such a move has occurred. Performance this time around has been middling relative to these other instances with Ethereum’s 43.9% rally through yesterday when the ratio crossed the 20% decline threshold roughly inline with the median performance of other instances (43.4%). Bitcoin on the other hand has actually been doing a little better with its 12.6% rally larger than the median of 9.8%.
As for where the two largest cryptos head from here, historical performance has been mixed. Overall Bitcoin has more consistently moved higher across the following year. One year out has perhaps been the period with the most dramatic outperformance of Bitcoin. Although it was only higher 60% of the time, Ethereum was only higher one year later once following the January 2021 instance. Click here to learn about Bespoke’s Weekly Crypto Report.
June 2022 Headlines
Bespoke’s Morning Lineup – 7/19/22 – Working on a Turnaround Tuesday
See what’s driving market performance around the world in today’s Morning Lineup. Bespoke’s Morning Lineup is the best way to start your trading day. Read it now by starting a two-week trial to Bespoke Premium. CLICK HERE to learn more and start your trial.
“Lots of companies don’t succeed over time. What do they fundamentally do wrong? They usually miss the future. I try to focus on that: What is the future really going to be?” – Larry Page
Below is a snippet of content from today’s Morning Lineup for Bespoke Premium members. Start a two-week trial to Bespoke Premium now to access the full report.
After a disheartening late-day decline yesterday, futures are attempting a ‘turn-around Tuesday’ this morning. In addition to a handful of high-profile earnings reports from IBM, Johnson & Johnson (JNJ), and Lockheed Martin (LMT), we also just got the latest update of Building Permits and Housing Starts which came in mixed relative to expectations. Building Permits were slightly higher than expected and Housing Starts missed slightly.
Another notable report this morning was the latest Merrill Lynch Fund Managers Survey which showed widespread pessimism on the part of respondents. According to the report, exposure levels to risk assets were taken down to their lowest levels since the Financial Crisis while cash levels are higher now than at any other time since 2001!
Today’s Morning Lineup discusses earnings news out of Europe and the US, handicapping the ECB decision, and economic data from around the world.
Everyone wants to see inflation subside, and we welcome any sign of a pullback in upward price pressures. The latest datapoint optimists are glomming on to is the fact that the national average price of a gallon of gas dropped below $4.50 per gallon yesterday after touching $5 as recently as mid-June. That’s a decline of nearly 10%!
The move lower in gas prices is welcomed by us more than anybody, but before we all close the book on this chapter in the inflation saga and let our guard down, we should keep in mind that from a seasonal perspective, we are in what has historically been a relatively weak time of year for prices at the pump. Prices typically peak for the year around Memorial Day, trade sideways through the summer, and then decline into year-end. Second, while prices are down sharply after the last month, it follows what was a parabolic increase in prices year to date through mid-June.
Despite a 7.2% decline so far in July and a nearly 10% decline over the last month, the national average price of a gallon of gas is still up 9.3% over the last three months, 36.8% year to date, and 42% over the last year! That’s hardly a trend of lower prices. Moving further out, the percentage gains have been even larger. Over the last two years, Americans are paying more than double what they were paying for gas, and over the last three and four years, the average price has increased by roughly 60%.
We’re pleased as anyone with the direction of gas prices over the last month, but just as we’ve seen countless examples of the market or individual stocks in downtrends stage an impressive rally only to give it all back again, let’s hope this move lower in gas prices isn’t a false alarm in the other direction.

Start a two-week trial to Bespoke Premium to read today’s full Morning Lineup.