Richmond Back in the Red
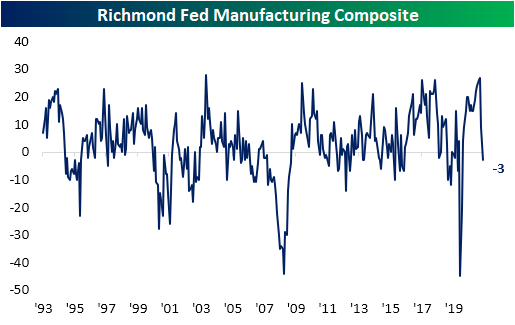
The fifth and final manufacturing survey for the month of September from the regional Federal Reserve banks was released this morning, and it did not end the month on a high note. The Richmond Fed’s headline reading fell into contractionary territory this month for the first time since May 2020 as the index dropped 12 points month over month falling from +9 down to -3. Relative to all the other regional Fed reports, Richmond only Richmond reported contraction in September.
The 12 point decline month over month in the headline reading was significant ranking in the bottom 5th percentile of all monthly moves. But it was actually a smaller decline than last month when the index dropped 18 points. Regardless, the 30-point combined decline over the past two months is the second largest on record behind the 38 point drop in April of last year.
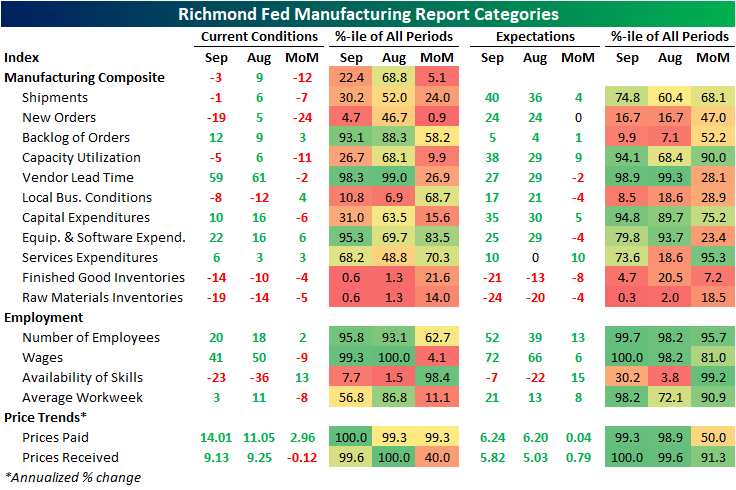
Factoring into that headline weakness, most of the categories of the report were also lower month over month. Given those declines, most readings are also now in the bottom end of their historical ranges with some exceptions. Order Backlogs, Vendor Lead Times, Equipment and Software Expenditures, Employees, Wages, and price indices are all still in the upper decline of readings.
By far the largest decline in September was for New Orders. That index plummeted 24 points versus August for the fourth-largest decline on record and putting the index in the bottom 5% of its historical range. In other words, demand slammed on the brakes in September. In spite of that decline, expectations have held up relatively well at 24; unchanged month over month. Shipments also fell into contraction albeit less dramatically. Meanwhile, Vendor Lead Times improved as the index fell 2 points, but that remains an extremely elevated reading indicating continued pressures on supply chains.
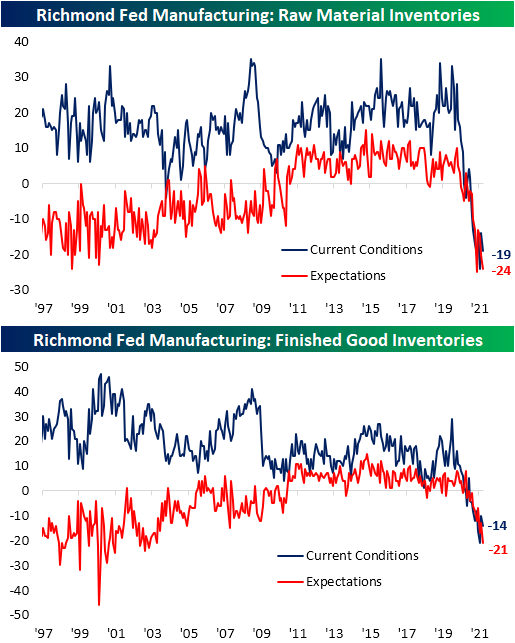
One potential reason for shipments having pulled back is a complete lack of inventories. Both readings on raw materials and finished good inventories fell month over month and are at historically depressed levels across both current conditions and expectations.
Indices tracking employment were perhaps the healthiest area of the report. The index tracking the Number of Employees edged higher to 20 while expectations saw an even larger jump, stopping just short of a record high. Wages, meanwhile, declined 9 points from a record high. That reading is still the third-highest on record, though, and expectations were at a record high. While the Average Workweek index was also lower MoM, there has been another improvement in the number of firms reporting a lack of availability of skilled workers.
The other area of the report to touch records this month concerned prices. Prices paid came in at a new high with prices increasing 14% annualized. Prices Received were slightly lower at 9.13%, but that is well above other readings throughout the survey’s history and the expectations index set another record. Click here to view Bespoke’s premium membership options.
September 2020 vs 2021
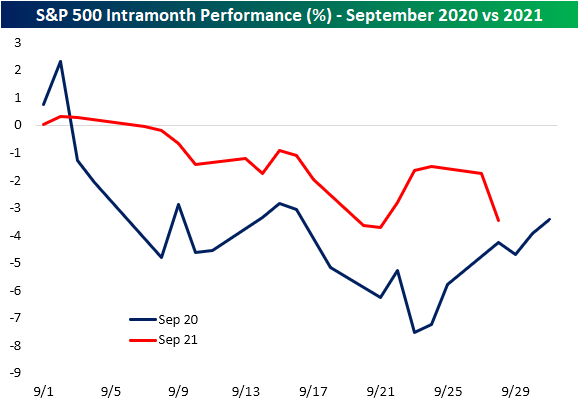
September 2nd of last year marked a notable turning point for the US equity market. The S&P 500 put in a short-term peak on that date and it also marked the beginning of what we dubbed “The Big Shift”. That shift was marked by the outperformance of value over growth and solid breadth with the equal-weight S&P 500 outperforming the market-cap weighted index. Fast forward one year, and yet again the close on September 2nd has marked the recent high for the S&P 500 as shown below. In addition to the highs coming on the same day, some of the intra-month patterns are also similar including a small rally in the middle of the month. With that said, the declines last year were more severe, especially at the start of the month, and this year has not seen a consistent rally into month’s end as was the case in 2020.
As previously mentioned, one of the most notable changes of the Big Shift last September 2nd was a reversal of a long-term trend of growth’s outperformance. Growth’s outperformance versus value peaked on September 2nd last year, and it also peaked in early September this year as well. Below is a chart showing the relative strength of growth versus value since the COVID Crash low for the broad market last March 23rd. A rising line means growth is outperforming, while a falling line means value is outperforming. The months of September 2020 and September 2021 (through 9/28) are highlighted in red. As you can see, growth peaked versus value at the beginning of September of both 2020 and 2021 after a period of sharp outperformance in the months prior. September 2020 was only the start of value’s outperformance, which continued up until this spring when growth began to outperform again. It remains to be seen if the same “value” trade will now continue in the months ahead like it did last year, but it’s certainly interesting how similar the growth/value trade has been this September versus last September. Click here to view Bespoke’s premium membership options.
Bespoke Stock Scores — 9/28/21
Bespoke Dividend Income Basket: Update & Commentary, September 2021
Chart of the Day – High Energy Energy Sector
B.I.G. Tips – State-Level Searches for COVID Tests (Update)
Bespoke’s Morning Lineup – 9/28/21 – Nasdaq Down 1%
See what’s driving market performance around the world in today’s Morning Lineup. Bespoke’s Morning Lineup is the best way to start your trading day. Read it now by starting a two-week trial to Bespoke Premium. CLICK HERE to learn more and start your trial.
“My formula for success is rise early, work late, and strike oil.” – J. Paul Getty
It’s looking like a weak morning for risk assets as the yield on the 10-year US Treasury continues to rip higher and pulls equity prices lower. Fed Chair Powell and Treasury Secretary Yellen will be testifying in DC today, and in Powell’s prepared remarks, which have already been released, the Chair noted that inflation is likely to remain elevated in coming months before moderating down the road. Outside of the Powell and Yellen testimony, negotiations over the debt ceiling, which don’t seem to be going anywhere at the moment, will be a key area of focus.
Read today’s Morning Lineup for a recap of all the major market news and events from around the world, including the latest US and international COVID trends.
Futures are lower across the board, but it’s the Nasdaq where selling pressure has been the most intense. The Nasdaq 100 tracking ETF (QQQ) is currently on pace to open down just over 1.5% which would represent the 13th downside gap of 1% or more for QQQ since the start of the year and the second one in September. The table below lists each prior occurrence this year and shows the magnitude of the downside gap along with QQQ’s performance from the open to close.
Intraday performance of QQQ following downside gaps of 1%+ illustrate the buy the dip mentality of the market so far in 2021. On the 12 prior days where QQQ gapped down more than 1%, the ETF saw an average gain of 0.30% (median: +0.55%) from the open to close with gains two-thirds of the time. Will today’s trading continue the trend so far of 2021 where dip buyers step in? We’ll know the answer to that in a little over seven hours.

Start a two-week trial to Bespoke Premium and read today’s full Morning Lineup.
Daily Sector Snapshot — 9/27/21
End to Supply Chain Issues Gets Pushed Back
In an earlier post, we highlighted the details of today’s manufacturing survey from the Dallas Fed. One more area to note in the report is supply chains. The index for Delivery Times remains off its peak from March, but this month experienced a small uptick to 21.4. That remains well above any historical precedence prior to the pandemic. Additionally, the expectations index for Delivery Times rose 9.9 points which ranks in the top 4% of all month-over-month moves. In other words, the Dallas Fed’s survey showed the region’s manufacturers neither reported improvement in supply chains nor did they report an optimistic outlook on the matter.
The special questions of this month’s survey added further fuel to the fire. As shown below, the regional bank asked “When do you expect supply chains to return to normal?” This question was first asked back in June of this year. Back then 71.8% of respondents reported that they expected the issues to resolve themselves within 9 months. But three months later, the answers to the same question had a more pessimistic tone. The entire distribution shifted, meaning a larger share of businesses expect supply chain problems to linger around longer. In fact, this time around only 58.7% reported expecting things to get back to normal within 9 months. Meanwhile, those expecting these issues to last 10 to 12 months jumped 8.1 percentage points and nearly 5 percentage points more expect the issues to last for more than a year. Click here to view Bespoke’s premium membership options.
Dallas Drop
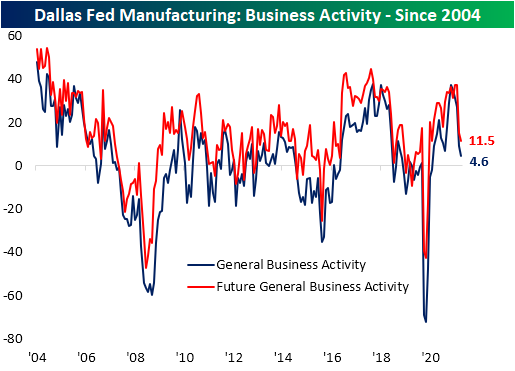
The fourth of five regional Fed manufacturing surveys came in this morning from the 11th district in Dallas. Whereas the New York and Philly Fed saw strong readings earlier this month, the Kansas City Fed and now the Dallas Fed’s survey were less positive. The Dallas Fed’s index fell to 4.6 versus expectations for an increase to 11.
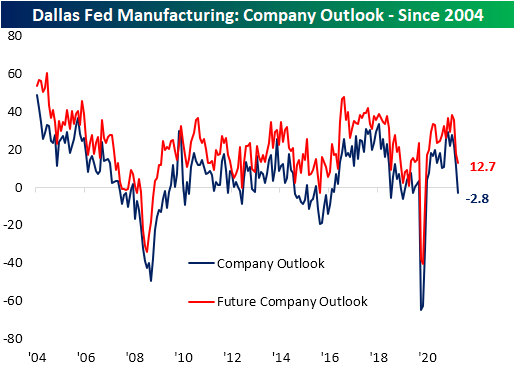
While the headline index was lower, it remained in expansionary territory in the middle of its historical range. The majority of other categories throughout the report also remain in expansion and are even at historically high levels with many in the upper decile of readings. The only real outlier was the index for Company Outlook.
The Company Outlook index plummeted 14.3 points month over month which is the seventh-largest decline of any month on record. That massive decline brought the index to its first negative reading since May of last year.
While the readings are still showing expansion, indices covering order volumes were also weaker versus August. Orders are growing at the weakest pace since last July, but on the bright side, shipments improved slightly to 18.7 in September. Paired with the slowed pace of new orders, the index for Unfilled Orders pulled back to the lowest level since February. While that means that businesses are likely working off backlogs, the index remains in the upper 5% of readings well above anything observed prior to the pandemic.
After falling back in July, Prices Paid continued to bounce back reaching 80.4 this month. That is only 0.4 points below the record high from back in June. Prices Received, meanwhile, set a new record high after gaining another 5.9 points.
Even though those prices continued to rise, Wages and Benefits saw another decline in September. That index peaked at 48.1 this past June and has declined to 42.7 in the months since then. That being said, the current level of the index is well above any other reading outside the past several months. In other words, companies are reporting that they are continuing to raise wages at a rapid pace. Meanwhile, if the rise in wages and benefits is not evidence of labor market tightness enough, employment also saw a modest pickup. That index rose 4.4 points to the highest level in five months when it was at a record. Although that indicates a modest acceleration in hiring, employers are looking to take on far more workers. The expectations index for this category rose to a record high in September; the only expectations index to do so.Click here to view Bespoke’s premium membership options.
