Daily Sector Snapshot — 9/12/22
11%+ Annualized – Not Bad for the ‘Worst Trade Ever’
It has now been 14 years since Lehman Brothers’ last day as a solvent company – an event that set off one of the biggest market meltdowns of all time. In hindsight, the events leading up to and after September 2008 may not seem all that bad. How quickly we forget. Three-quarters of a century removed from the Great Depression, most Americans had never given a second thought to the safety of the funds in their savings account or even money-market funds, but shortly after Lehman, these were legitimate concerns on the part of all Americans. People were actually going to ATMs and taking out extra cash to literally put ‘under their mattress’ just in case they woke up and the ATMs weren’t working anymore.
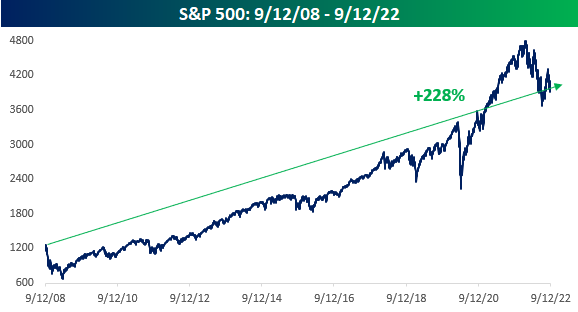
Most of these extremes came after the Lehman bankruptcy, but the period leading up to Lehman wasn’t a picnic either; that’s actually why Lehman went belly-up. From the S&P 500’s peak in October 2007 through 9/12/08, the S&P 500 was down over 20%. But after an early summer sell-off, the S&P 500 rallied from mid-July to mid-August before selling off into Labor Day. Heading into the weekend after Labor Day, the S&P 500 was down 4% from its mid-August high but appeared to be stabilizing at a higher low relative to July. With the S&P 500 still down 20% from its all-time high, you couldn’t have faulted someone heading into the weekend for thinking “maybe I’ll try to buy something on sale.”

On 9/12/08, stocks may have been on sale relative to the October 2007 highs, but any buys on that day would quickly go down as one of the ‘worst trades ever.’ After Lehman announced its bankruptcy that weekend, cracks spread all over the financial district from a Wall Street parched of liquidity. September ended with a decline of nearly 10% but continued to get worse from there, and by the following March, the S&P 500 was down just under 46% – or 71% annualized – from its ‘pre-Lehman’ close’. Stocks that seemed cheap less than six months earlier were now down by nearly half, so getting back to even from there would pretty much require a double. Speaking from experience, any investor who bought any stocks in those six months quickly felt like the stupidest investor in the world.

While any equity purchases made 14 years ago just before Lehman collapsed quickly turned into some of the worst trades ever, time is an investor’s best friend. Anyone who had time gradually looked less foolish. From a longer-term perspective, the decline from September 2008 to March 2009 still looks painful, but over time, the market (as it has to this point always done) dug itself out of its hole. The snowball effect of compounding has rewarded investors who were in it for the long haul. Not including dividends, the S&P 500 has rallied more than 228% since the Friday before Lehman’s bankruptcy, and including dividends, it has delivered an annualized return of more than 11%. You’d probably sign the bottom line as fast as you could for an annualized return of 11% between now and 2036!
Not bad for what seemed like the “worst trade ever” at the time. Click here to learn more about Bespoke’s premium stock market research service.
Speculators Short Precious Metals As Miners Surge
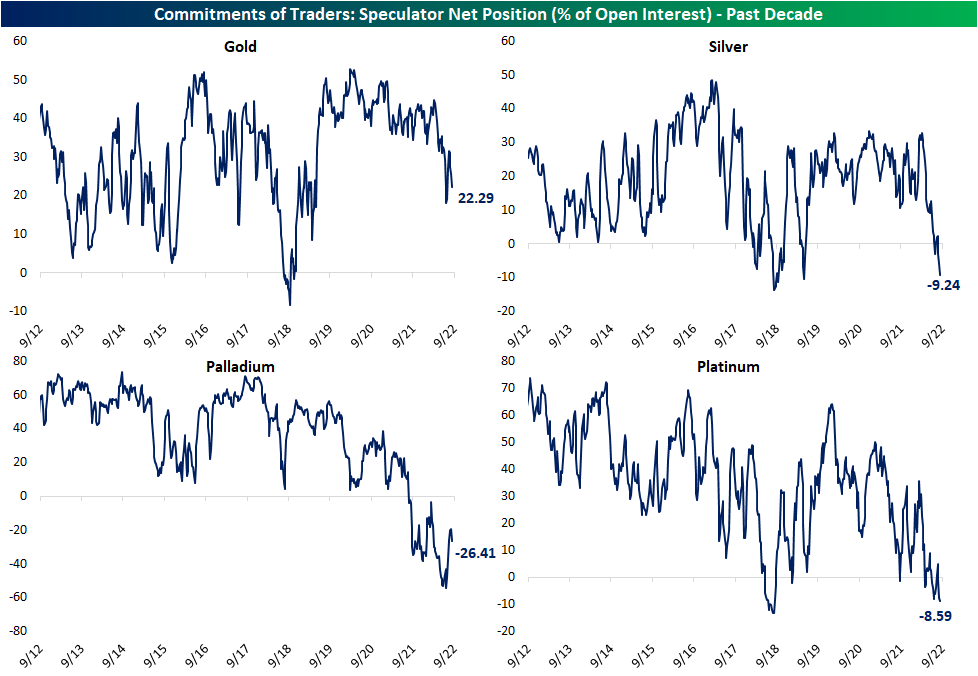
The latest CFTC’s Commitments of Traders report with data as of last Tuesday was released on Friday. This report tracks how speculators are positioned among various futures which we show as a net reading in the charts below. Positive readings indicate a net percentage of open interest is long whereas a negative reading indicates a larger share of speculators are positioned short in a given future. Below, we take a look at those readings for a handful of precious metal futures.
As shown, gold has rarely seen more shorts than longs over the past decade and is the only precious metal currently positioned net long (+22.29%). However, that is not to say this reading has not been weakening lately. This past spring, the reading fell outside of the past few years’ range, reaching a low of 18% back in mid-July. While the second half of July and some of August saw it rebound, last week marked three straight weeks of declines. Meanwhile, silver futures have seen positioning turn outright short recently. With a net 9.24% of open interest positioned short, that is the most pessimistic positioning reading since May 2019. Likewise, it has been almost four years since platinum has been as heavily bet against as now. Finally, palladium has also seen speculators turn against it in the past year to a degree not seen at any point of the past decade.
As we do each Monday, in tonight’s Closer we will provide a more in depth rundown of this data for a wide variety of assets.
As speculators turn increasingly bearish, we are actually coming off of a very strong week for metal adjacent ETFs. As shown in the screenshot of our Trend Analyzer below, the best performing ETFs last week in our US Groups screen were gold miners (GDXJ and GDX) as well as the Steel ETF (SLX) that tracks steel producers and suppliers. The Junior Gold miners (GDXJ) rallied double digits over the prior five days, which was a move that lifted it out of extreme oversold territory and almost back up to its 50-DMA.The Gold Miners ETF (GDX) was not far behind with an 8.85% rally. SLX was only a percentage point behind that as it presses into overbought territory for the first time since August 29th. Click here to learn more about Bespoke’s premium stock market research service.

Chart of the Day – Volatile Fridays
Bespoke’s Morning Lineup – 9/12/22 – Starting Off On a Positive Note
See what’s driving market performance around the world in today’s Morning Lineup. Bespoke’s Morning Lineup is the best way to start your trading day. Read it now by starting a two-week trial to Bespoke Premium. CLICK HERE to learn more and start your trial.
“See things in the present, even if they are in the future. ” – Larry Ellison

Below is a snippet of content from today’s Morning Lineup for Bespoke Premium members. Start a two-week trial to Bespoke Premium now to access the full report.
It looked earlier like futures were going to pick right up where they left off last week, but the positive tone in the pre-market has been weakening ahead of the opening bell. There wasn’t much to drive the positive tone earlier, and there has been no apparent catalyst for the weakness in the last half hour. It’s a quiet day for data today as there are no economic reports on the calendar, and the only earnings report of note is Oracle (ORCL) after the close. The big report of the week comes tomorrow, though, when August CPI will be released at 8:30 AM. Economists are currently forecasting the headline reading to show a decline of 0.1%, although, given the trajectory of gas prices and other secondary indicators, so-called whisper numbers are even more negative.
The holiday-shortened week started off poorly last week but finished on a strong note with three straight gains including two days where the S&P 500 surged 1%+ on solid (+400) breadth. The rally also helped to bring the S&P 500 back above its 50-DMA. It’s been a roller-coaster summer for US stocks as the monster rally in the S&P 500 tracking ETF (SPY) off the June lows failed right at the 200-DMA and downtrend line from the January highs. The sell-off was arrested last week right at the uptrend from the June lows, and with three weeks of trading left in the third quarter, the S&P 500 finds itself in a bit of no man’s land.

All eleven sectors have turned in positive returns over the last five trading days (which includes the Friday before Labor Day). Materials and Consumer Discretionary have led the stampede with gains of just under 5% while Financials aren’t far behind rallying by 3.65%. Consumer Staples is the only sector up less than 1% and one of just three sectors still below its 50-DMA. The only two other sectors below that level are Communications Services and Technology. They are also both the only sectors down over 20% YTD. Given its size in the market, Technology is usually the sector that leads the ship, but it is nice to see that the broader market can rally even if that sector underperforms.

Our Morning Lineup keeps readers on top of earnings data, economic news, global headlines, and market internals. We’re biased (of course!), but we think it’s the best and most helpful pre-market report in existence!
Start a two-week trial to Bespoke Premium to read today’s full Morning Lineup.
Bespoke Brunch Reads: 9/11/22
Welcome to Bespoke Brunch Reads — a linkfest of the favorite things we read over the past week. The links are mostly market related, but there are some other interesting subjects covered as well. We hope you enjoy the food for thought as a supplement to the research we provide you during the week.
While you’re here, join Bespoke Premium with a 30-day free trial!
Tech Dystopia
The Rise of Mobile Gambling Is Leaving People Ruined and Unable to Quit by Maxwell Strachan (Vice)
Problem gamblers used to have to drive to a casino or at least a gas station. Now, smartphones deliver a near-constant barrage of prompts and opportunities to gamble, creating disastrous consequences for personalities who are attracted to risk. [Link]
‘It’s a slippery slope’: Most consumers underestimate monthly subscription costs by at least $100, study says by Sarah O’Brien (CNBC)
Low monthly prices, automatic payments, and easy sign-ups mean that consumers are paying over $100/month in forgotten subscriptions. [Link]
China
China’s COVID-19 Stagnation Has No End in Sight by James Palmer (Foreign Policy)
Political leadership remains anchored to its zero COVID policy. [Link]
China’s Economic Slump Bodes Ill for Birth Numbers by Liyan Qi (WSJ)
Low birth rates mean Chinese deaths are set to outnumber births as soon as this year; models suggest the total population is set to fall from just over 1.4bn to below 800mm by the end of this century. [Link; soft paywall]
Ukraine
‘We have already lost’: far-right Russian bloggers slam military failures by Pjotr Sauer (The Guardian)
Far right military bloggers in China are starting to lose hope that the country’s invasion may eventually succeed as Russian lines collapsed in the country’s east and south this week. [Link]
Russia Is Buying North Korean Artillery, According to U.S. Intelligence by Julian E. Barnes (NYT)
Facing shortages of key inputs for construction of even the most basic military equipment, Russia is turning to minor allies to source warfighting material. [Link; soft paywall]
Loosening Markets
Housing Market Update: Mortgage Rate Spike Further Cools Homebuying and Selling by Tim Ellis (Redfin)
Some markets are starting to see outright price declines as new listings plunge, price cuts abound, and the combination of soaring mortgage rates and sky-high prices destroy demand. [Link]
Ocean Shipping Rates Have Plunged 60% This Year by Costas Paris (WSJ)
After a desperate scramble to book freight capacity amidst an avalanche of demand for goods, retailers are faced with inventory overhangs and the freight market is falling apart with shipping rates collapsing in 2022. [Link; paywall]
Retail Activity
Robinhood Unveils Index to Track Customers’ Favored Stocks by Alexander Osipovich (WSJ)
A new index constructed by free-to-trade brokerage Robinhood weights stocks by their customers’ “conviction” or relative frequency shares are held in customers’ accounts. [Link; paywall]
EXCLUSIVE Deal partner for Trump’s Truth Social fails to get backing for SPAC extension -sources by Svea Herbst-Bayliss (Reuters)
As a deadline to approve the proposed blank check takeover of Trump’s nascent social media company loomed, the transaction looked like it might be in doubt. [Link]
Read Bespoke’s most actionable market research by joining Bespoke Premium today! Get started here.
Have a great weekend!
The Bespoke Report — 9/9/22
Daily Sector Snapshot — 9/9/22
A Year of Friday Action
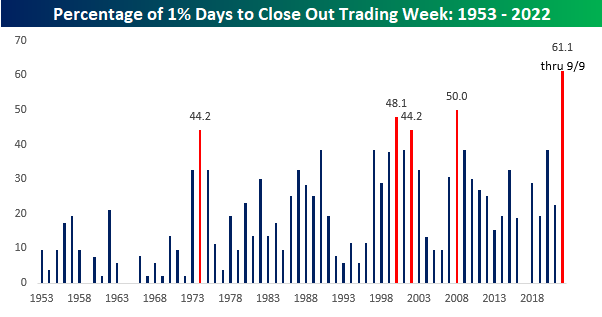
There’s still time left in the trading day which means that anything can happen, but the equity market is on pace to close out the week with a Friday gain or loss of 1%+ for the 22nd time this year. Going back to 1953 when the five-trading day week started on the NYSE, there have only been four other years where the S&P 500 rallied or declined at least 1% on the final trading day of the week (there have been another six where there were 20). The only years where there were more 1% moves to close out the week were 1974 (23), 2000 (25), 2002 (23), and 2008 (26). Keep in mind, though, that while this year is just four off the record-high pace, there are still 16 weeks left in the year! The year is only two-thirds complete, but already Fridays have seen a lot of action.

To make more of an apples-to-apples comparison, on a percentage basis, 61% of all weeks this year have closed out with a one-day move of at least 1%. Granted, it’s not a full year of prices yet, but in prior years since 1953, there was never a year where the S&P 500 closed out the trading week with a gain or loss of at least 1% more than half of the time. In 2008, half of all weeks ended with moves of that magnitude while the percentage in 2000 was 48.1%, and 1974 and 2002 each closed out the week with 1%+ moves 44% of the time. These levels of volatility are a far cry from a year like 2017 when there wasn’t a single Friday that the S&P 500 rallied or declined 1%. Click here to learn more about Bespoke’s premium stock market research service.
Bespoke’s Morning Lineup – 9/9/22 – Closing on a Positive Note
See what’s driving market performance around the world in today’s Morning Lineup. Bespoke’s Morning Lineup is the best way to start your trading day. Read it now by starting a two-week trial to Bespoke Premium. CLICK HERE to learn more and start your trial.
“I believe that, young or old, we have as much to look forward to with confidence and hope as we have to look back on with pride.” – Queen Elizabeth II
Below is a snippet of content from today’s Morning Lineup for Bespoke Premium members. Start a two-week trial to Bespoke Premium now to access the full report.
After its longest losing streak in years ended earlier this week, the Nasdaq is now on pace for a third straight day of gains and a positive week for stocks. The last time the Nasdaq was up three days in a row was to close out July. The catalyst for this morning’s rally appears to be weaker-than-expected inflation data out of China and some weakness in the dollar. Treasury yields are flat to lower even as crude oil is up over 1%.
While she was queen 15 different prime ministers served under Queen Elizabeth II. That’s a lot! Another statistic we found interesting was that during her reign there were also 13 separate bear markets in the US (20%+ declines from a high on a closing basis with no rallies of 20%+ in between), including one where the S&P 500 declined over 50% and another where it dropped over 48%. Besides those, there were five other bear markets where the S&P 500 lost more than one-third of its value. In economic terms, there have been eleven confirmed recessions in the US since the Queen was coronated in 1953, and we could be on the verge of a twelfth now.
During each of these economic and market downturns, it probably felt like the end of the world, and you couldn’t have faulted someone for panicking at the moment, but with the benefit of hindsight, each of those periods ended up being nothing more than a bump in the road (some more than others). During the Queen’s reign, the S&P 500 rallied more than 16,000% or more than 7.6% annualized before even taking dividends into account. With dividends, the annualized rate of return is over 10%. US Real GDP per capita over that same period increased by three and a half times rising from $17,093 to $59,288. With the benefit of all that experience, if you had told the Queen that the economy was contracting or that stocks were on the verge of a bear market, rather than pull her hair out and freak out, instead, in her normally calm demeanor, she would have likely responded with something along the lines of “been there, done that”.

Our Morning Lineup keeps readers on top of earnings data, economic news, global headlines, and market internals. We’re biased (of course!), but we think it’s the best and most helpful pre-market report in existence!
Start a two-week trial to Bespoke Premium to read today’s full Morning Lineup.