Bespoke’s Morning Lineup – 11/30/22 – One Month to Go
See what’s driving market performance around the world in today’s Morning Lineup. Bespoke’s Morning Lineup is the best way to start your trading day. Read it now by starting a two-week trial to Bespoke Premium. CLICK HERE to learn more and start your trial.
“There is nothing government can give you that it hasn’t taken from you in the first place.” – Winston Churchill

Below is a snippet of content from today’s Morning Lineup for Bespoke Premium members. Start a two-week trial to Bespoke Premium now to access the full report.
European stocks are trading higher this morning as inflation in the region came in at a weaker-than-expected 10% y/y. 10%! If that doesn’t sum things up for 2022, we don’t know what does. Economists were forecasting the headline number to come in at 10.4%, but with the m/m reading actually falling 0.1% in November, markets are rallying.
Futures here in the US are also higher on the positive inflation data out of Europe, but there’s still a lot of data on the calendar to contend with starting off with the November ADP Employment report which came in at a weaker-than-expected 127K (estimate 198K). The second read of Q3 GDP, Core PCE, and Personal Consumption will all be released at 8:30, and then at 10 AM, we’ll get the October report on Pending Home Sales. The 8:30 data was just released and came in mixed relative to expectations with GDP revised higher while PCE came in higher than expected. Besides all the economic data, Powell’s speech at the Brookings Institution at 1:30 is likely to be the biggest market mover of the day.
While US stocks are set to end the month of November with modest gains, stocks in Hong Kong have been on a tear as the benchmark Hang Seng index rallied an astonishing 26.62% for its largest monthly gain since October 1998 and just its ninth monthly gain of 25% or more since 1970. As great as this month’s rally in Hong Kong stocks sounds, we would note that since the end of August, the index is still down nearly 7%, and YTD it’s down over 20%. Again, these performance numbers are after you factor in November’s rally. The S&P 500 may only be up 2% this month, but since the end of August, it is actually up fractionally, and YTD it’s not down as much as the Hang Seng.

You’ve likely heard the phrase that big market moves tend to occur during bear markets but in the case of the Hang Seng and monster moves, that hasn’t entirely been the case. The chart below shows Hong Kong’s benchmark index going back to 1970 with red dots indicating every time the index moved 25% or more in a month. Looking at the chart, more of these moves actually tended to occur in the later stages of bull market runs or early on in a rally. What is unique about November’s move is that it is only the second time that the index rallied 25%+ but was still down over the trailing three months. The only other time that occurred was in January 1975 when the Hang Seng rallied more than 28% but was still down nearly 2% over the last three months. It’s a sample size of one, but bulls wouldn’t mind if history repeated itself.

Our Morning Lineup keeps readers on top of earnings data, economic news, global headlines, and market internals. We’re biased (of course!), but we think it’s the best and most helpful pre-market report in existence!
Start a two-week trial to Bespoke Premium to read today’s full Morning Lineup.
Daily Sector Snapshot — 11/29/22
Chart of the Day – 2s10s Inversion Streak Reaches Triple Digits
Home Prices Down But Still Sky-High
September numbers for home prices across the country were released by S&P CoreLogic Case Shiller this morning. Below is a look at how much home prices are up since February 2020 just before COVID hit. The National index is up 41%, while Tampa, Phoenix, and Miami are all up 63% or more. At the lower end of the gains are Washington DC, Minneapolis, San Francisco, and Chicago with price increases between 27% and 31%.

Prices are off of their post-COVID highs, however, and remember that this data is only through September. We’ve likely seen prices fall even further over the last two months. As shown below, the 10-city and 20-city composite indices are down 3.9%, while the National index is down 2.6%. San Francisco and Seattle have seen the biggest drops in home prices so far with declines of more than 11%. San Diego is down 7.9%, Los Angeles is down 6.0%, and Denver is down 5.7%. Cleveland, Chicago, Atlanta, Miami, New York, and Tampa have thus far seen the smallest drops from their highs with declines ranging from -0.8% to -1.3%.

Below is a table showing the data from the two charts above along with a look at month-over-month and year-over-year percentage change. So far at least, cities in the western US have seen the biggest declines from their post-COVID highs, while areas in the southeastern US and south Florida that saw some of the biggest post-COVID gains have only seen minimal declines.

Below are long-term charts of the twenty individual city home price indices along with the National and 10-city and 20-city Composite indices. These charts really show how much home prices rose over the last couple of years and how small the declines have been so far. The recent drop has been like going from the 100th floor down to the 99th floor of an NYC skyscraper. Click here to learn more about Bespoke’s premium stock market research service.


Bespoke Stock Scores — 11/29/22
MAGA Out of Favor
With the flare-up of protests in China sparking concerns about production disruptions at Foxconn factories, shares of Apple (AAPL) are once again down 20% from their all-time closing high. With that move, all four of the mega-cap ‘MAGA’ stocks – Microsoft (MSFT), AAPL, Alphabet aka Google (GOOGL), and Amazon.com (AMZN) – are now down at least 20% from their all-time closing highs. Along with AAPL’s 22% drawdown, the three others have seen declines in excess of 30% with AMZN down over 50% from its record high.
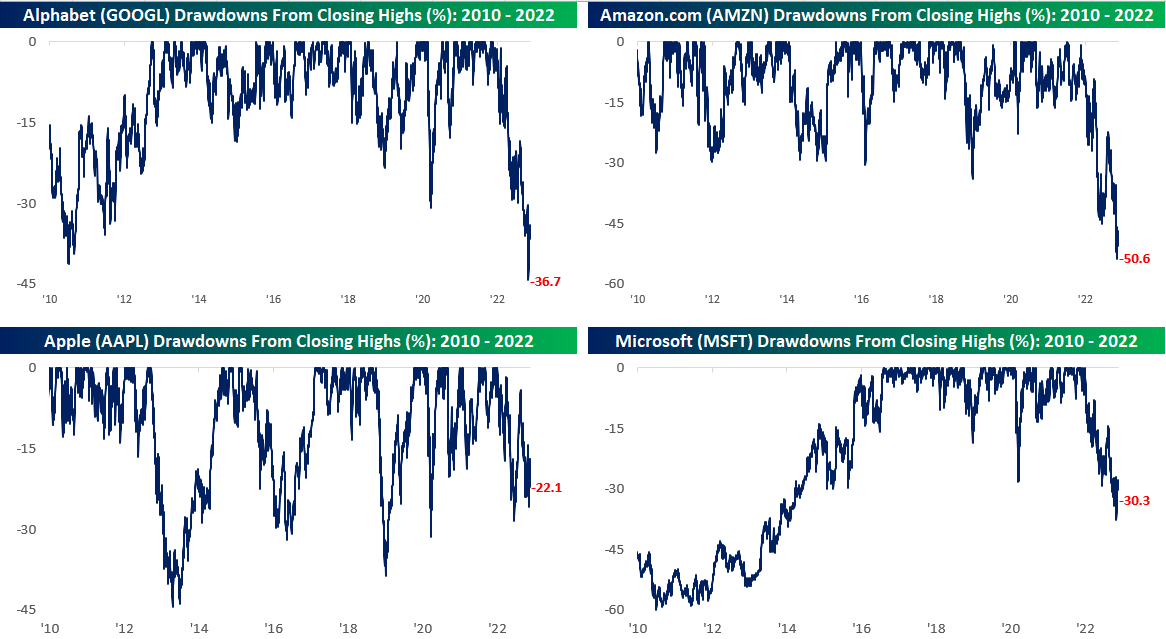
While all four of the largest stocks in the S&P 500 are down at least 20% from their highs, it’s quite a juxtaposition with the S&P 500 which is down ‘only’ 17.8%. Before yesterday, the only time since 2010 that all four MAGA stocks were down at least 20% and the S&P 500 was down less than 20% was in a six-week period from mid-May to late June (shaded area in chart). For years, mega-caps were credited with driving the broader market gains as they handily outperformed their smaller market-cap peers. In 2022, we have seen the opposite trend play out as mega caps are still seeing larger moves, but to the downside instead of to the upside. Look on the bright side, think about how much worse the picture would look if smaller stocks in the S&P 500 were still underperforming their mega-cap peers. Click here to learn more about Bespoke’s premium stock market research service.

Speculators Bet Against the 2 Year
As we do each Monday, in last night’s Closer we discussed the most recent positioning data from the CFTC’s Commitments of Traders report. We express this data as the net percentage of open interest of futures only. In other words, positive readings indicate a net share of open interest is positioned long, while negative readings indicate that shorts are outnumbering longs.
Below is a look at speculator positioning on Treasury futures across the 2-year, 5-year, 10-year, and the long bond. Positive readings mean speculators are net bullish on the price of the bonds (expecting lower yields), while negative readings mean speculators are bearish (net short) on price (expecting higher yields). While futures traders are net short all four of the bond futures shown, they’re most bearish on the 2-year, meaning they’re positioned for higher 2-year yields (and lower prices). As shown in the top left chart, the last two weeks have seen the most extreme short positioning in the 2-year Treasury since April 1992.
From a sentiment perspective, traders appear overly confident that higher 2-year yields are on the way even though we’ve already seen the 2-year yield rise from 0.50% up to 4.45% over the last year. This seems notable from a contrarian perspective. Click here to learn more about Bespoke’s premium stock market research service.

Bespoke’s Morning Lineup – 11/29/22 – Confidence Game
See what’s driving market performance around the world in today’s Morning Lineup. Bespoke’s Morning Lineup is the best way to start your trading day. Read it now by starting a two-week trial to Bespoke Premium. CLICK HERE to learn more and start your trial.
“What I learned is that nothing is given easy to you.” – Christian Pulisic
Below is a snippet of content from today’s Morning Lineup for Bespoke Premium members. Start a two-week trial to Bespoke Premium now to access the full report.
Futures were higher earlier this morning, but those gains have been evaporating like morning dew with the sunrise. Reports that China is on the verge of finally starting to relax some of its COVID restrictions helped to contribute to the positive tone in global markets overnight. The catalyst for that sentiment appears to be a story that the CCP is beginning to urge older people to get vaccinated. Reports from other sources suggest that the government will also announce that because current strains of COVID are less virulent, extreme measures to stop the spread can be relaxed. We’ve heard a number of these rumors in recent months only to see the CCP reiterate its strict zero-Covid policy, but these stories seem to have a little bit more momentum behind them.
News of a reopening in China has commodities rallying, and WTI is back to just under $79 per barrel, although the 10-year yield is a couple of basis points lower. The economic calendar is on the light side again today with housing price data at 9 AM Eastern and Consumer Confidence at 10. Over in Europe, inflation data out of Spain and Germany was lower than expected. Down south in Brazil, inflation data came in lower than expected as the y/y rate fell below 6% for the first time since 2019!
Yesterday wasn’t the type of performance that bulls were hoping for coming back from the Thanksgiving weekend holiday. With a decline of 1.54%, it was the S&P 500’s 9th worst post-Thanksgiving Monday performance in the post-WWII period. As disappointing of a day as it was for bulls, the Monday after Thanksgiving typically hasn’t been a very good day for the stock market. Since 1945, the S&P 500’s median performance on the day has been a decline of 0.29% with positive returns just 39% of the time. For comparison, on all trading days since 1945, the S&P 500’s median change has been a gain of 0.05% with positive returns 53% of the time. As demoralizing of a day that it may have been for bulls, one silver lining to Monday’s weakness is that in the nine prior years where the S&P 500 was down 1%+ on the Monday after Thanksgiving, its median performance for the rest of the year was actually better than the median for all other years.

Our Morning Lineup keeps readers on top of earnings data, economic news, global headlines, and market internals. We’re biased (of course!), but we think it’s the best and most helpful pre-market report in existence!
Start a two-week trial to Bespoke Premium to read today’s full Morning Lineup.
Daily Sector Snapshot — 11/28/22
Black Friday and Cyber Monday Discounts Retailers (XRT)
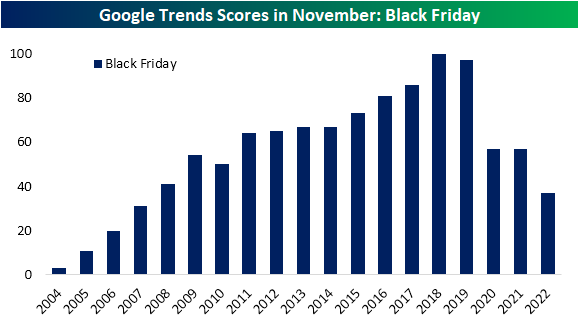
Black Friday and Small Business Saturday are now in the rearview and Cyber Monday is underway as the holiday shopping season is off to the races. There has been a secular shift to online shopping over the past decade meaning Black Friday has a larger online element than the early bird in-store sales of yesteryear. Cyber Monday, meanwhile, may not be the main e-commerce-focused shopping day of the post-Thanksgiving week. Regardless, data from Adobe showed record online sales this year on Black Friday. While those actual sales figures are perhaps a more concrete and noteworthy data point to gauge the success of the day in generating sales, we would note that Google Search activity for the shopping day has been on the decline in the month of November (when it peaks) for the past few years now. The pandemic in particular has resulted in a sharp downward move in searches for the term. In fact, this year is on pace to have seen the lowest search interest for “Black Friday” since 2007, though with the month not quite over, data is still technically incomplete and can be revised higher.
Similarly, news story mentions of Black Friday and Cyber Monday have generally trended lower over the past few years. In the chart below, we show the number of monthly news story mentions as tracked by Bloomberg in November of the terms throughout the past decade. To make it read similar to the chart above, we have indexed these readings to their peaks at 100.
Cyber Monday mentions peaked all the way back in 2018 and are currently around the low end of readings of the past several years. Black Friday, meanwhile, peaked last year, but that appears to have been a bit of an outlier as readings have generally been trending lower since 2019. All of this is not necessarily to say Cyber Monday and Black Friday are less important than in the past, but instead have likely become more ingrained into the holiday season and thus less talked about/researched.

As for how that translates to retail stocks, like consumers, investors appear to get lower prices from retailers during the busiest shopping days of the year! On average, the SPDR S&P Retail ETF (XRT) has declined 0.22% on Black Friday during its history and 1.3% on Cyber Monday. That compares to an average gain of 5 bps on all days. Additionally, there has been little consistency in positive price action. XRT has only risen a little better than a third of the time on Black Friday and just 17.65% of the time on Cyber Monday. In other words, today’s 0.66% drop in the ETF is by no means unusual. Click here to learn more about Bespoke’s premium stock market research service.
