Country ETFs Outperforming US Recently
For most major global equity markets, at some point this Fall a 52-week low has been put in place, with significant rallies since then. As shown below, of the 22 ETFs tracking key country stock markets in our Global Macro Dashboard, the average gain off the low is now 22%. The largest of these rallies have come from Germany (EWG), Italy (EWI), and China (MCHI), which have all risen over 30%. For China, that gain has come in the shortest span of time with October 31st being its low, whereas Italy and Germany’s lows were a few weeks further back. One other interesting note regarding China is currently it trades only slightly above its 50-DMA whereas a majority of other country ETFs are in or at least near overbought territory. On the other end of the spectrum, the US (SPY) has experienced the most modest rally having only risen 13.82%. India (INDA) is close behind with a 13.89% gain, although it bottomed before the rest of the world with its 52-week low being back on June 17th.

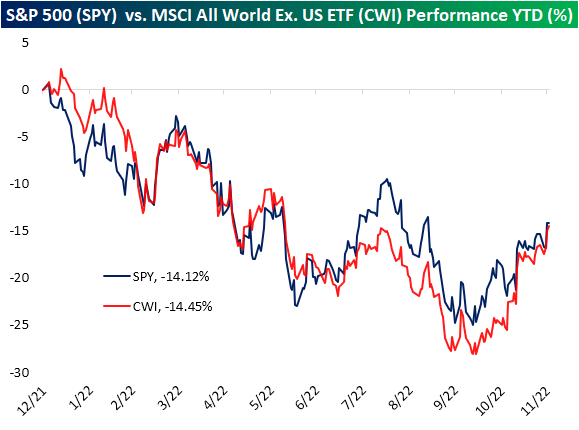
While much of the rest of the world has experienced a larger rebound off the lows, year to date performance between the US (SPY) and global equities excluding the US—proxied by the MSCI All World ex. US ETF (CWI)—is now very similar. The US is marginally in the lead with a -14.12% YTD total return versus a 14.45% drop for CWI. At the lows at the end of Q3, international markets were underperforming the US by more than 5 percentage points, but that gap has been closed during the current rally. Click here to learn more about Bespoke’s premium stock market research service. As always, past performance is no guarantee of future results.
Bears Hibernating
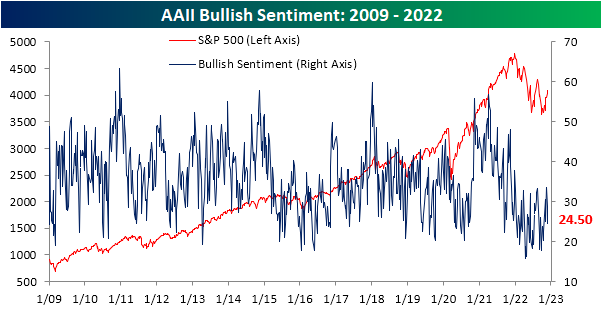
Although the S&P 500 has had some positive technical developments like taking out the 200-DMA on the backs of a lack of hawkish Fedspeak, sentiment has been headed lower over the past couple of weeks. Per the latest survey data from AAII, only 24.5% of investors reported as bullish this week; down from 28.9% last week and a recent high of 33.5% the week before that. That nine percentage point decline in the past couple of weeks is not a particularly large drop and only brings the reading into the middle of this year’s range, however, it marks a distinct turnaround from what had been one of the most optimistic readings of the year only two weeks ago.
As bullish sentiment has been on the move, bearish sentiment has gone into hibernation and done a whole lot of nothing. After being unchanged at 40.2% last week, bearish sentiment rose modestly to 40.4%.

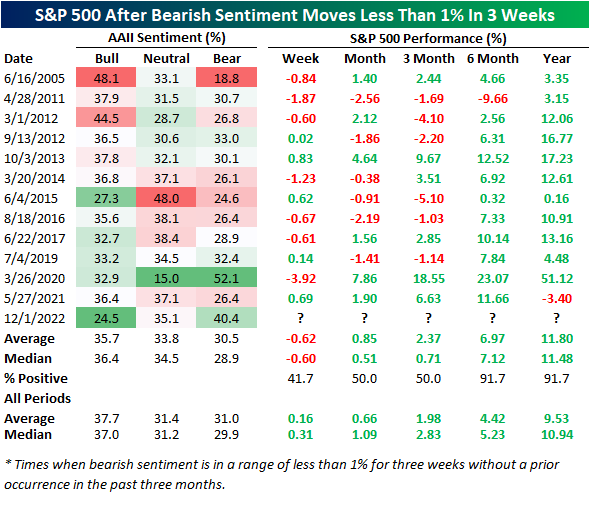
In the history of the survey, that is the tightest three-week range on record and there have only been another dozen times in which bearish sentiment readings were even within a 1% range over a three-week span. The most recent of those was last May, and there was another right around the time of the COVID Crash lows. We would note that with bears little changed around 40%, the current instance marks the second highest bearish sentiment reading of these instances behind that March 2020 occurrence.
In terms of what it means for the S&P 500 when bearish sentiment moves so little as it has recently, near-term performance does not tend to be particularly favorable. One week out has averaged a 0.6% decline and one and three-month returns have been positive only half the time. As for longer-term performance though, the S&P 500 has tended to trade higher six months to one year out very consistently with gains over 90% of the time. Those gains are also slightly larger than the norm for all periods.
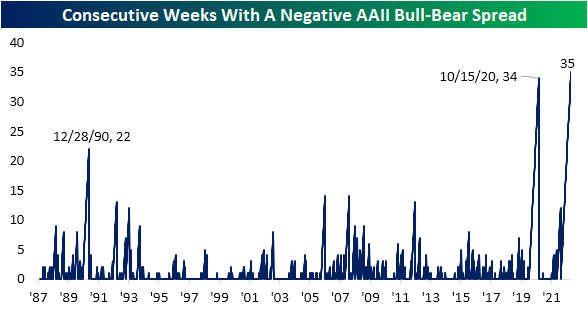
With sentiment taking negative tones, the bull-bear spread has reversed lower after some of the highest readings of the year last month. Given the spread remains negative, the streak of below-zero readings has grown to a record 35 weeks in a row, surpassing the 2020 streak.

Given bears have not picked up the losses to bulls, nearly all of the difference has gone to neutral sentiment. Neutral sentiment has risen to 35.1% which is 1.4 percentage points below the high from the first week of November. Click here to learn more about Bespoke’s premium stock market research service.

The Bespoke 50 Growth Stocks — 12/1/22
The “Bespoke 50” is a basket of noteworthy growth stocks in the Russell 3,000. To make the list, a stock must have strong earnings growth prospects along with an attractive price chart based on Bespoke’s analysis. The Bespoke 50 is updated weekly on Thursday unless otherwise noted. There were three changes to the list this week.
The Bespoke 50 is available with a Bespoke Premium subscription or a Bespoke Institutional subscription. You can learn more about our subscription offerings at our Membership Options page, or simply start a two-week trial at our sign-up page.

The Bespoke 50 performance chart shown does not represent actual investment results. The Bespoke 50 is updated weekly on Thursday. Performance is based on equally weighting each of the 50 stocks (2% each) and is calculated using each stock’s opening price as of Friday morning each week. Entry prices and exit prices used for stocks that are added or removed from the Bespoke 50 are based on Friday’s opening price. Any potential commissions, brokerage fees, or dividends are not included in the Bespoke 50 performance calculation, but the performance shown is net of a hypothetical annual advisory fee of 0.85%. Performance tracking for the Bespoke 50 and the Russell 3,000 total return index begins on March 5th, 2012 when the Bespoke 50 was first published. Past performance is not a guarantee of future results. The Bespoke 50 is meant to be an idea generator for investors and not a recommendation to buy or sell any specific securities. It is not personalized advice because it in no way takes into account an investor’s individual needs. As always, investors should conduct their own research when buying or selling individual securities. Click here to read our full disclosure on hypothetical performance tracking. Bespoke representatives or wealth management clients may have positions in securities discussed or mentioned in its published content.
Continuing Claims Range Return and Recession Warning
Initial jobless claims dipped this week erasing most of the prior week’s increase. Last week’s level was revised up by 1K to 241K and fell down to 225K in the most recent data. That is 10K below forecasts and continues what has been a fairly choppy trend in the indicator. Initial claims are going on roughly two months of switching back and forth between weekly increases and decreases with the most recent print in the middle of the past six-month range. In other words, there has not been much in the way of a consistent or clear pattern in jobless claims.

On a non-seasonally adjusted (NSA) basis, last week saw the usual dip in claims for Thanksgiving week. For this week of the year, claims have historically only risen 29% of the time. While the direction of the move was consistent with history, the 50.5K decline in the unadjusted number was fairly significant, coming in around 12K more than the historical median for the comparable week of the year. Due to that larger-than-normal drop, claims remain at impressive levels with only 1968 having seen a lower reading for the comparable week of the year.

Recent readings on continuing claims continue to starkly contrast with those solid readings in initial claims. Whereas initial claims have returned to levels consistent with the few years prior to the pandemic for some time now, continuing claims have been well below their own pre-pandemic range. That is until this week. Claims have continued to rise, and as of the week of November 19th (continuing claims are lagged an additional week to the initial claims number), continuing claims rose back above 1.6 million for the first time since the end of February. That is also back into the low end of the pre-pandemic range.
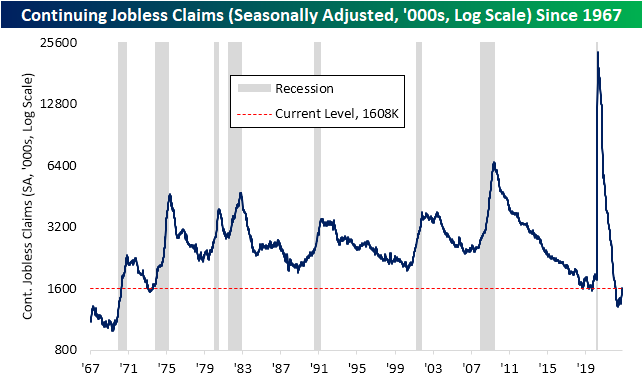
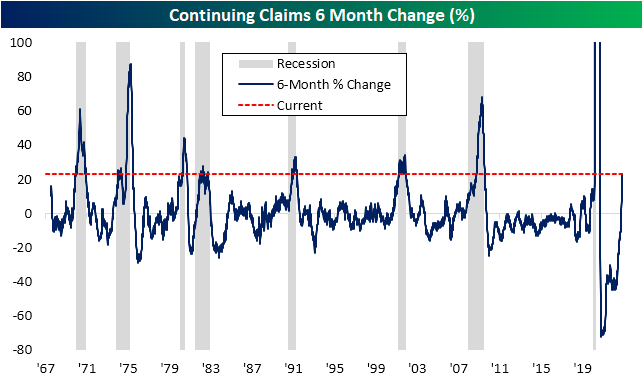
We would also note that this week’s data marks six months out from the May 21st low of 1.306 million. With claims having risen over 300K (or 23.12%) since then with a particularly sharp increase in the most recent print, that six-month rate of change appears to be a warning sign for recession. As shown below, there is plenty of precedent for claims to have risen by as large, if not larger, of a degree in half a year, but every one of those periods has occurred in the midst of a recession. All that is to say that claims continue to sit at healthy levels for the moment but the picture is changing- for the worse. Click here to learn more about Bespoke’s premium stock market research service.
Bespoke’s Morning Lineup – 12/1/22 – No Time to Rest
See what’s driving market performance around the world in today’s Morning Lineup. Bespoke’s Morning Lineup is the best way to start your trading day. Read it now by starting a two-week trial to Bespoke Premium. CLICK HERE to learn more and start your trial.
“To bring about change, you must not be afraid to take the first step. We will fail when we fail to try.” – Rosa Parks

Below is a snippet of content from today’s Morning Lineup for Bespoke Premium members. Start a two-week trial to Bespoke Premium now to access the full report.
It was looking like a little bit of a hangover this morning as futures were modestly lower, but as yields have continued to plunge and the dollar declines, futures have been drifting higher. It’s a busy day for economic data with Jobless Claims, PCE, Personal Income, and Personal Spending all on the docket at 8:30 and then ISM Manufacturing at 10 AM. Outside of the US, China’s PMI was below 50 but stronger than expected. There’s also been some additional optimism for growth prospects on reports that the country will further relax COVID restrictions. Commodities are rallying in reaction to the news, and WTI is firmly above $81 per barrel after trading in the low $70s earlier this week.
The 8:30 data was just released and initial claims came in lower than expected while continuing claims surged above 1.6 million. Inflation data was roughly in line to slightly better than expected. Personal Income was well above expectations (0.7% vs 0.4%) while Personal Spending came right in line with estimates (0.8%). In response to the data, futures have been ticking higher.
After August’s miserable failed attempt to break above the 200-day moving average and the double-digit percentage loss that followed, bulls had been attempting to take out that level again in the last couple of weeks. Just when it looked as though the latest attempt was running out of steam, yesterday’s Fed-fueled rally finally got the job done. Whether or not it holds will be the real test.
Before bulls could even start to celebrate the breakout of the 200-DMA, another resistance level looms above. From the high in early January, you can draw a perfectly straight line connecting the dots of the subsequent lower highs we have seen this year, and yesterday’s close is the fourth point in that line.

Yesterday’s 3.1% rally was the second-best day of the year for the S&P 500 in terms of performance and the seventh-best breadth reading. At +461 it was still a strong reading but were it not for underperformance in the Energy sector, which accounted for about a third of the 24 stocks in the index that traded lower on the day, breadth would have been even stronger. Yesterday’s +461 reading was also the second all-or-nothing day of the week. That brings the year’s total to 45 and puts 2022 on pace for 49 all-or-nothing days. Already 2022 ranks fourth in terms of the most all-or-nothing days for a calendar year since 1990, but anything above 48 would rank at least third behind 2008 (52) and 2011 (70). In terms of volatility, 2022 ranks right up there with the best of them.

Our Morning Lineup keeps readers on top of earnings data, economic news, global headlines, and market internals. We’re biased (of course!), but we think it’s the best and most helpful pre-market report in existence!
Start a two-week trial to Bespoke Premium to read today’s full Morning Lineup.
Daily Sector Snapshot — 11/30/22
Purchases Rebound and Refinances Plunge
Prospective home buyers have finally gotten some relief at least in terms of mortgage rates. The national average for a 30-year fixed rate mortgage via Bankrate.com’s data is down to 6.78% from a high of 7.35% on November 3rd. While that remains at levels we haven’t seen since the early 2000s, the roughly half of one percentage point decline in the past three weeks is also remarkable. As shown in the second chart below, on Monday, the national average had fallen 0.53 percentage points in a three-week span. The only other time in which there was as large of a drop in that period of time was in September 2008.

Given rates for 30-year mortgages are at the highest level in a couple of decades, there has been little incentive for most homeowners to refinance resulting in refinance applications continuing to evaporate. Applications fell 12.87% week over week bringing the index down to the lowest level since June 2000.

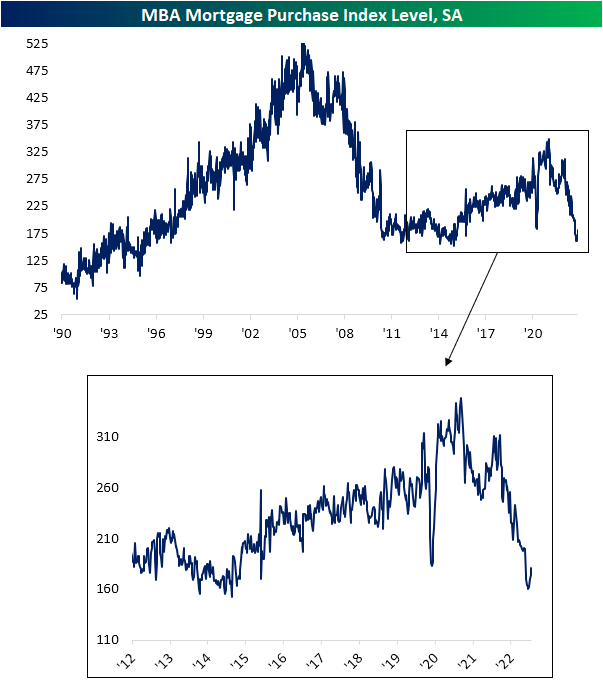
Purchases applications have been more largely impacted by the recent reversal in rates. The Mortgage Bankers Association’s purchase index has now risen four weeks in a row (the longest streak of consecutive increases since last November). The 12.77% jump in purchase applications in that time has been the largest four-week jump since a 14.61% increase in November of last year. Of course, that only puts a minor dent in the absolute collapse in mortgage activity over the past year.
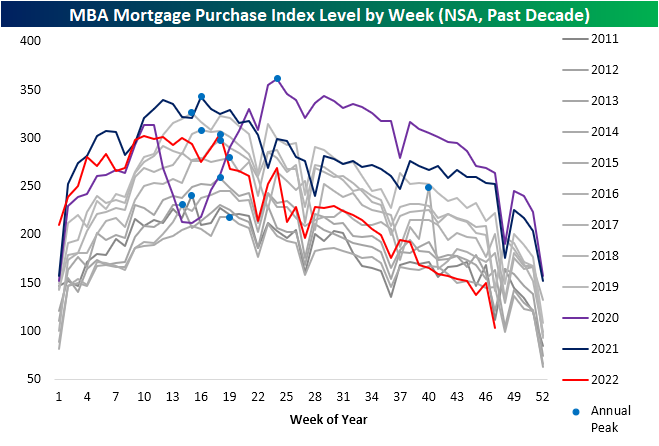
Showing purchase applications on a non-seasonally adjusted basis better illustrates housing’s fall from grace this year. Whereas applications started the year around some of the highest levels of the past decade for that time of year, this week they have hit the lowest level for the comparable week of the year of the past decade. That’s what happens when the FOMC embarks on one of the most aggressive tightening cycles in history! Of course, the Thanksgiving holiday tends to negatively impact implications, and looking at 2014 (when the Thanksgiving drop occurred a week later than this year) applications were slightly lower than this year.
Shown another way, below we show the percent change in applications from each year’s respective annual peak out through 29 weeks later. This year has seen applications fall 66%. That was a similar decline to 2001, and the only year with a larger decline was in 2007. Click here to learn more about Bespoke’s premium stock market research service.

Chart of the Day: December 2022 Seasonality
Bespoke’s Morning Lineup – 11/30/22 – One Month to Go
See what’s driving market performance around the world in today’s Morning Lineup. Bespoke’s Morning Lineup is the best way to start your trading day. Read it now by starting a two-week trial to Bespoke Premium. CLICK HERE to learn more and start your trial.
“There is nothing government can give you that it hasn’t taken from you in the first place.” – Winston Churchill
Below is a snippet of content from today’s Morning Lineup for Bespoke Premium members. Start a two-week trial to Bespoke Premium now to access the full report.
European stocks are trading higher this morning as inflation in the region came in at a weaker-than-expected 10% y/y. 10%! If that doesn’t sum things up for 2022, we don’t know what does. Economists were forecasting the headline number to come in at 10.4%, but with the m/m reading actually falling 0.1% in November, markets are rallying.
Futures here in the US are also higher on the positive inflation data out of Europe, but there’s still a lot of data on the calendar to contend with starting off with the November ADP Employment report which came in at a weaker-than-expected 127K (estimate 198K). The second read of Q3 GDP, Core PCE, and Personal Consumption will all be released at 8:30, and then at 10 AM, we’ll get the October report on Pending Home Sales. The 8:30 data was just released and came in mixed relative to expectations with GDP revised higher while PCE came in higher than expected. Besides all the economic data, Powell’s speech at the Brookings Institution at 1:30 is likely to be the biggest market mover of the day.
While US stocks are set to end the month of November with modest gains, stocks in Hong Kong have been on a tear as the benchmark Hang Seng index rallied an astonishing 26.62% for its largest monthly gain since October 1998 and just its ninth monthly gain of 25% or more since 1970. As great as this month’s rally in Hong Kong stocks sounds, we would note that since the end of August, the index is still down nearly 7%, and YTD it’s down over 20%. Again, these performance numbers are after you factor in November’s rally. The S&P 500 may only be up 2% this month, but since the end of August, it is actually up fractionally, and YTD it’s not down as much as the Hang Seng.

You’ve likely heard the phrase that big market moves tend to occur during bear markets but in the case of the Hang Seng and monster moves, that hasn’t entirely been the case. The chart below shows Hong Kong’s benchmark index going back to 1970 with red dots indicating every time the index moved 25% or more in a month. Looking at the chart, more of these moves actually tended to occur in the later stages of bull market runs or early on in a rally. What is unique about November’s move is that it is only the second time that the index rallied 25%+ but was still down over the trailing three months. The only other time that occurred was in January 1975 when the Hang Seng rallied more than 28% but was still down nearly 2% over the last three months. It’s a sample size of one, but bulls wouldn’t mind if history repeated itself.

Our Morning Lineup keeps readers on top of earnings data, economic news, global headlines, and market internals. We’re biased (of course!), but we think it’s the best and most helpful pre-market report in existence!
Start a two-week trial to Bespoke Premium to read today’s full Morning Lineup.