B.I.G. Tips – Extreme Drawdowns
Another Regional Fed Index Declines
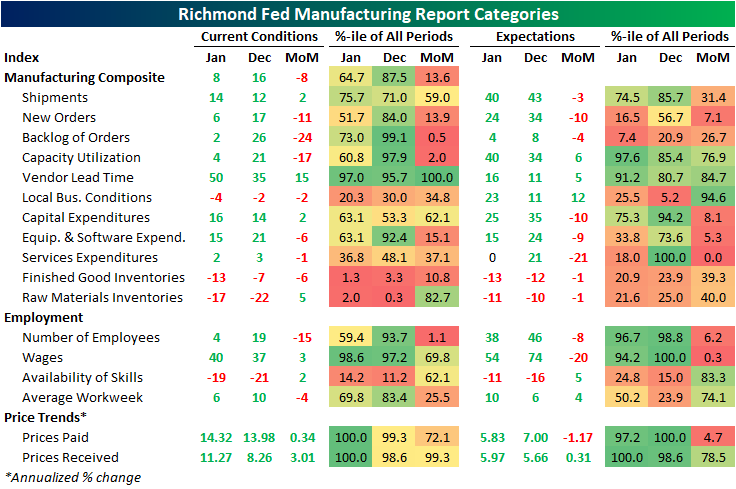
The latest regional manufacturing index out of the Richmond Fed was released today covering the month of January. Whereas the Empire Fed reading plummeted and the Philly Fed bounced, the Richmond Fed’s index more went the way of the former. The index was cut in half falling 8 points to a level of 8. The current level continues to indicate expansionary activity but at a slower rate.
Breadth was weak in the report with most categories falling month over month across both current conditions and expectations. A handful of these were historically large declines too. For example, the decline in the Service Expenditure expectations index was the largest on record. Whereas last month many categories saw readings in the upper few percentiles of their historical ranges, this month most were more middling. But there are some exceptions as prices, vendor lead times, and wages all remain at or close to record highs.
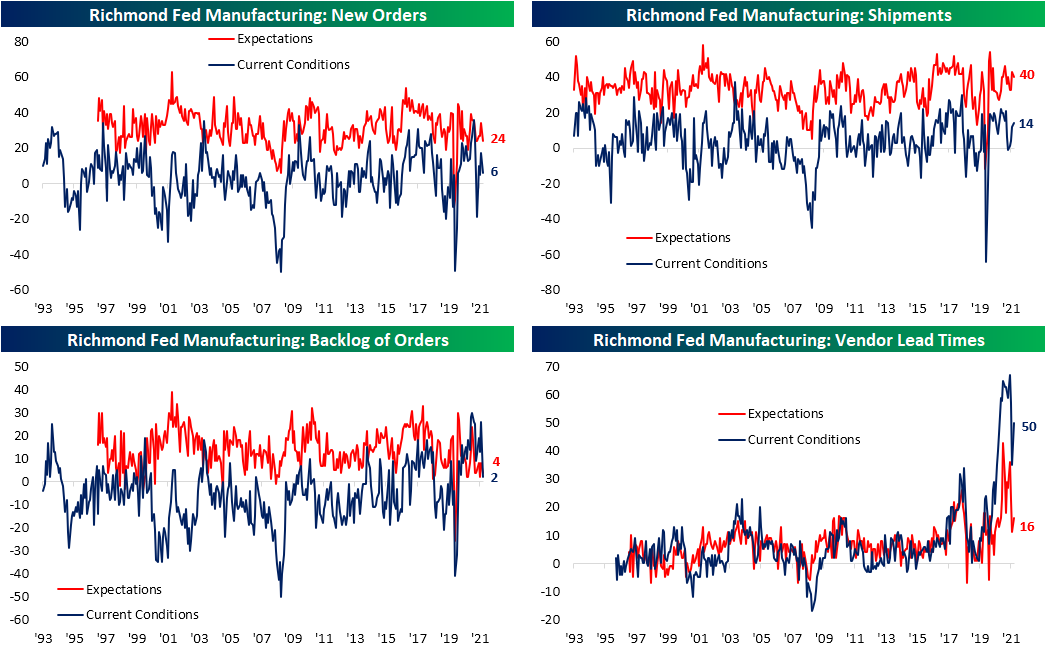
Growth in new orders slowed significantly. The 11 point drop ranks in the 13th percentile of all monthly changes. The drop in backlogs was much more dramatic, though, with its 24 point decline ranking as the third-largest on record. Even though shipments accelerated, so too did vendor lead times with a record 15 point MoM increase. While there was that sharp increase, the index remains below the levels it sat at for most of last year.
Another area to experience a sharp decline in January was the index for the number of employees. The 15 point decline ranks as the sixth-largest on record indicating a rapid deceleration in hiring. The average workweek also declined meaning existing employees worked fewer hours. The index tracking the availability of skills continued to recover off of historic lows, but the current levels still point to a large talent gap. Wages also saw a minor bump this month, but expectations fell sharply with the month-over-month decline tied for the second-largest drop on record.
Not only were prices for labor higher but so too were prices paid and received. Both indices set new record highs well above any reading observed prior to the pandemic. Expectations moved in opposite directions though. Expectations for prices paid fell to a 5.83% annualized rate while expectations for prices received rose to a record high of 5.9%. Click here to view Bespoke’s premium membership options.
Chart of the Day – Big Declines Leading Up to the FOMC
Semis Slide Below 200-Day
Breadth has been all-around bad recently. For example, as we highlighted in our Sector Snapshot, the 10-day advance-decline lines for the S&P 500 and the Tech sector are hovering close to the lowest levels since March 2020. We’re about as oversold as it gets from a short-term trading perspective. The semis are starting to break down too. Today, assuming it keeps up the pace of declines, the Philly SOX index is looking to close below its 200-DMA for the first time since the spring of 2020 as the uptrend off the COVID lows is on the ropes.
It has been well over a year since the Philadelphia Semiconductor index, or the SOX, has last closed below its 200-DMA. Assuming no historic jaw-dropping afternoon rally the likes of which haven’t been seen since…yesterday, the group is looking to end a 435 trading day streak of closes above its 200-DMA. Going back through the history of the index beginning in the mid-1990s, there have only been three streaks that have gone on for longer.
While it is not a particularly large sample size, given its reputation as a leading sector, we wanted to highlight the performance of the semis and the broad market after long streaks above the 200-DMA for semis come to an end. The only outright consistently negative performance in the following weeks and months was in 2000 during the dot com bust following the end of the streak in August 2000. Overall, median performance one week and one month later has been far stronger than the norm for the semis, Tech, and S&P 500. Going further out, things are more mixed relative to each index’s respective norm. For example, the semis are typically worse than normal 3 and 6 months out but have a larger than normal median performance one year out. Technology and the S&P 500 more broadly, meanwhile, have seen worse than normal performance 6 and 12 months out and inline performance 3 months later.
Bespoke Morning Lineup – 1/25/22 – Turnaround Tuesday (The Other Way)
See what’s driving market performance around the world in today’s Morning Lineup. Bespoke’s Morning Lineup is the best way to start your trading day. Read it now by starting a two-week trial to Bespoke Premium. CLICK HERE to learn more and start your trial.
“The only place success comes before work is in the dictionary.” – Vince Lombardi
The rally was fun while it lasted, and after yesterday’s impressive turnaround, futures on the major averages are all pointing to declines of more than 1% in early trading. After surges in volatility like the one we have seen in the last few days if you were expecting a quick return to calm, think again. Volatility is here to stay in the near future, especially with earnings season heating up, the FOMC meeting Wednesday, and oh yeah, major geopolitical tensions around the world.
Today’s economic calendar is on the light side with Consumer Confidence and the Richmond Fed report at 10 AM. Both reports are expected to show a slight pullback relative to last month’s readings.
Read today’s Morning Lineup for a recap of all the major market news and events from around the world, including the latest US and international COVID trends.
Yesterday’s volatility saw a surge in trading volume relative to levels of the last year. Volume in the S&P 500 tracking ETF (SPY) topped 252 million shares which was the highest level of daily volume since March 2020 right in the thick of the COVID crash. Going further back, though, there have been plenty of other periods where daily volume in SPY was much larger than yesterday’s level.

When adjusting for SPY’s price, though, yesterday saw a near-record volume in terms of value traded. Based on the closing price yesterday, roughly $111 billion was traded in SPY yesterday. The only day where a higher value was traded was back in late February 2020 when the daily dollar volume topped $114 billion.

Start a two-week trial to Bespoke Premium to read today’s full Morning Lineup.
B.I.G. Tips: Big Upside Reversals
Daily Sector Snapshot — 1/24/22
Triple Plays Taking A Snooze
A triple play is when a company reports better than expected results on the top and bottom line while also raising guidance. We consider these to be the gold standard for earnings, generally speaking, as they indicate a strong fundamental picture relative to expectations. Since the big banks kicked off earnings, though, triple plays have been hard to come by with only 5 of 92 total reports having been triple plays, and those five stocks have averaged a 1.61% decline on their earnings reaction days; slightly worse than the 1.56% average decline for all stocks reporting earnings so far.
Expanding the time frame, in the chart below we show the percentage of stocks reporting triple plays on a three-month rolling basis similar to the charts of beat rates in our Earnings Explorer tool. As shown, the pandemic has been a boon for triple plays as a result of a mix of pessimistic forecasts and strong rebounds. The percentage of stocks reporting triple plays over the past two years has been unlike anything in the history of our data going back to 2001. With that said, gravity has been hitting the triple play rate as it is heads into the current earnings season at the low end of the range since the fall of 2020.
With triple plays more frequent, they appeared to have lost their luster with weaker full-day changes on earnings than what was observed for most of the time prior to the pandemic. As the triple play rate has come down, stock price reactions have improved but are still on the weaker side relative to history. Currently, over the past three months the average triple play has rallied a little over 4% the day after earnings compared to 5.21% historically. Click here to view Bespoke’s premium membership options. You can monitor earnings triple plays on a daily basis with a Premium membership.
New Lows Expanding for the Nasdaq 100
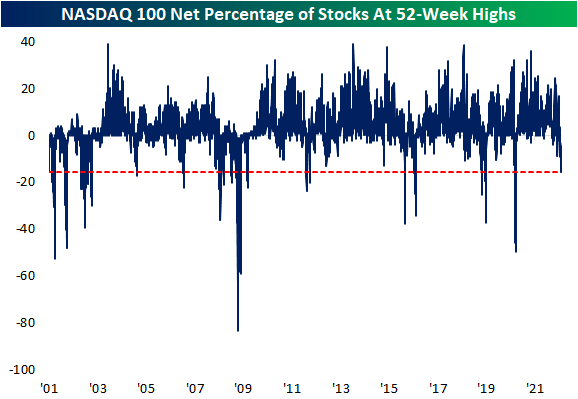
In an earlier post, we highlighted weak breadth for the S&P 500 Tech sector which now has just 9.2% of stocks above their 50-day moving averages. Pivoting over to the tech-heavy NASDAQ 100, another look at bad breadth is the new low in the net percentage of stocks setting new 52-week highs versus 52-week lows. As shown below, a net 15.68% of the NASDAQ 100 is at 52-week lows today which is the lowest reading since the COVID Crash in March 2020. At the lows during the COVID Crash, nearly half of the index hit 52-week lows. There have only been a few other times going back to the beginning of the data in early 2001 in which this reading got this low. The current reading is only in the 2nd percentile of the historical range.
The chart below shows the distance from 52-week high for all of the Nasdaq 100’s members. There are currently only a dozen names that are currently within single-digit percentage points from their 52-week highs, while the average stock in the index is now 25.2% below its 52-week high. Click here to view Bespoke’s premium membership options.
Bye Bye Moving Averages
As of mid-day, the only sector that is not down over 2% is Consumer Staples, and even that defensive sector is down over 1.5%. As a result of the big declines across the market recently, there has been a notable drop in the percentage of stocks trading above their moving averages. Just a little over a week ago, over half of S&P 500 stocks traded above their 50-DMAs. Today, that reading is closer to a quarter of the index. As for the individual sectors, the readings for Consumer Discretionary, Real Estate, and Technology have fallen into single digits. One area that is holding up remarkably well is Energy with over 90% of its stocks above their 50-DMAs. Consumer Staples is the only other sector with more than three-quarters of its stocks above their 50-DMAs.
The readings with regards to the longer-term 200-DMA have held up better. 41% of the S&P 500 is above their 200-DMAs, but that too is down considerably versus the start of the year when three-quarters of the index was above their moving averages. Once again, Energy stands out with a far healthier reading at 90.5%, but that is actually the first sub-100% reading for Energy since January 6th. Real Estate, Financials, Consumer Staples, and Utilities have the next strongest readings. Click here to view Bespoke’s premium membership options.


