Bespoke’s Weekly Sector Snapshot — 1/12/23
Bears Back Down
The S&P 500 has rallied impressively in the past week leading up to Thursday’s CPI print, and bullish sentiment has lifted along with it. While the reading remains low, the percentage of respondents to the weekly AAII sentiment survey reporting as bullish rose from 20.5% up to 24%. Bulls were higher only two weeks ago when the reading was at 26.5%

That rise in bulls has meant bearish sentiment has fallen to a notable level. For the first time since the first week of November and for only the eleventh time in the past year, bearish sentiment came in below 40%. Bearish sentiment has now fallen for three weeks in a row, which is the longest streak of consecutive declines since last August as well.

Although bullish and bearish sentiment are sending a more optimistic tone, the bull-bear spread remains heavily in favor of bears at -15.9. That grows the record streak of negative readings to 41 weeks in a row.


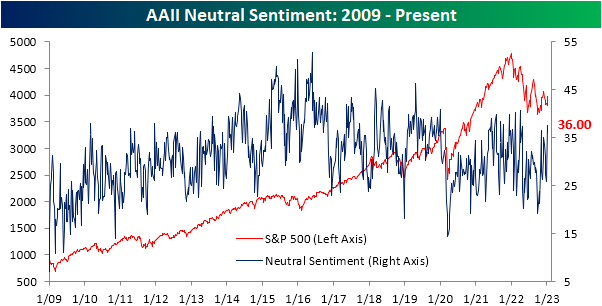
Last week, neutral sentiment leaped higher given the mid-single-digit declines in bulls and bears. Some of that move was given back this week with only 36% reporting as neutral. However, that remains an elevated reading at 4.6 percentage points above the historical average. Click here to learn more about Bespoke’s premium stock market research service.
Claims Drop But Were the Holidays Helping?
Initial jobless claims posted another low reading in the latest print, with national seasonally adjusted claims totaling only 205K. That was down slightly from 206K the previous week; a number revised up by 2K. After that revision, this week’s reading was the strongest showing for claims since the end of September.

Before seasonal adjustment, claims were considerably higher at 339.29K. At the end of the year and in the first weeks of a new year, claims tend to experience a significant seasonal increase which appears to be playing out in the current environment. This year’s reading is in line with the comparable weeks of the few years prior to the pandemic. As we also noted last week, this time of year tends to see the largest revisions in claims as well. In other words, from a seasonal perspective, claims can be a bit volatile in terms of actual levels and revised levels. So while the seasonally adjusted reading was solid and the non-seasonally adjusted number is nothing too concerning, the next several weeks will likely provide a clearer reading on how claims are trending.

Turning to continuing claims, this week’s print covered the final week of 2022. Like initial claims, the end of the year saw declines in continuing claims with the latest reading falling to a low of 1.634 million; the strongest level since the week of November 19th. Although that is a solid improvement following multiple months of claims rising rapidly, similary to initial claims, more weeks of data will help to provide a clearer picture given the effects of seasonality during the holidays.

We would also note, that although the drop in claims over the past two weeks has only put a small dent in the recent rise in claims, the 4.89% decline is historically large. That drop impressively ranks in the bottom 3% of all 2-week moves on record. Click here to learn more about Bespoke’s premium stock market research service.

Bespoke’s Morning Lineup – 1/12/23 – Bring An Umbrella Just in Case
See what’s driving market performance around the world in today’s Morning Lineup. Bespoke’s Morning Lineup is the best way to start your trading day. Read it now by starting a two-week trial to Bespoke Premium. CLICK HERE to learn more and start your trial.
“What weather they shall have is not ours to rule.” – J.R.R. Tolkien

Below is a snippet of content from today’s Morning Lineup for Bespoke Premium members. Start a two-week trial to Bespoke Premium now to access the full report.
In weather-speak, they call an atmosphere like this morning, the calm before the storm. Overnight in Asia, stocks were little changed and that was almost literally the case with the Nikkei rising just 0.01%. Chinese stocks were a little more biased to the upside with a gain of 0.20%. In Europe, the mood is considerably better as major benchmark indices in the region are all up over 0.50%. Bond yields in the US are modestly higher, and both crude oil and natural gas are higher after the latter attempts to bounce from 52-week lows reached on Tuesday following a massive three-week decline.
None of these moves really matter, though, as the 8:30 release of the December CPI – “the most important economic release in generations” – will dictate the tone of the trading day. With the President scheduled to speak on inflation later this morning, there is some speculation that the White House got an early look at the report and is looking to spike the ball on the administration’s policies to combat inflation.
If there’s one place where hyperbole rules, it’s in discussions pertaining to the market. We would argue, though, that the recent moves in natural gas may not have been talked about enough given how large the declines have been relative to history.
Let’s start with the short-term. Over the 15 trading days ending yesterday, natural gas dropped 36.9%. That alone is one of the most extreme downside moves in the history of the contract, but a week ago today, the 15-day decline was 46.4% which was the most extreme downside move on record (since 1990).

From a longer-term perspective, the declines have been just as large. In the 100 trading days ending Wednesday, the front month natural gas future declined 59.8% which also ranks as the most extreme downside move on record. The only other times there were declines of a magnitude in the ballpark of the current drop were in 2001 and 2006.

The scatter chart below compares the 15-day rate of change (x-axis) in natural gas prices to the 100-day rate of change (y-axis). The highlighted section at the bottom left with the most extreme downside moves over both a 15- and 100-day period all occurred so far in 2023. Whereas most other large 15-day declines followed periods when natural gas prices were up over the prior 100 trading days, the current period has been a snowball of weakness on top of weakness.

Our Morning Lineup keeps readers on top of earnings data, economic news, global headlines, and market internals. We’re biased (of course!), but we think it’s the best and most helpful pre-market report in existence!
Start a two-week trial to Bespoke Premium to read today’s full Morning Lineup.
Chart of the Day: 2022’s Losers Lead the Way
The Closer – Surging Copper, Soaring Franc – 1/11/23
Log-in here if you’re a member with access to the Closer.
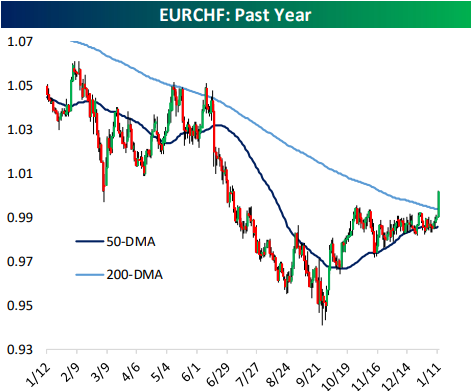
Looking for deeper insight into markets? In tonight’s Closer sent to Bespoke Institutional clients, we begin with a look at the surge in copper over the past week and what that has done for the Chilean Peso. We also check in on credit spreads and auto lending (page 1). We then pivot over to a look at the Euro and European stocks (page 2). Next, we dive into the BLS data of expenditure and income data for 2021 (page 3) followed by a recap of the strong 10 year reopening (page 4) and massive crude oil inventory build (page 5).
See today’s full post-market Closer and everything else Bespoke publishes by starting a 14-day trial to Bespoke Institutional today!
Daily Sector Snapshot — 1/11/23
Chart of the Day: Energy Prices Down Year Over Year
Bespoke’s Morning Lineup – 1/11/23 – Zigging and Zagging
See what’s driving market performance around the world in today’s Morning Lineup. Bespoke’s Morning Lineup is the best way to start your trading day. Read it now by starting a two-week trial to Bespoke Premium. CLICK HERE to learn more and start your trial.
“It is easy to quit; I’ve done it at least a hundred times.” – Unknown
Below is a snippet of content from today’s Morning Lineup for Bespoke Premium members. Start a two-week trial to Bespoke Premium now to access the full report.
Flights across the US are grounded due to an outage at the FAA, but stocks remain airborne as futures are modestly higher across the board, and the Nasdaq is looking to extend its winning streak to four straight days. News flow looks to be relatively light as there are no major economic reports on the calendar, and the only earnings report is KB Home (KBH) after the bell. Tomorrow will be the big day of the week, though, when the December CPI will be released at 8:30. Then, on Friday we’ll start to get the first of the big earnings reports from the major banks.
Back on this day in 1964, the US Surgeon General issued a report on smoking that was thought to be so damaging to the tobacco industry that he waited until a Saturday when markets were closed to release it to limit the potential stock market chaos. The day after the report was released it was front page top of the fold news in the New York Times with a headline reading “Cigarettes Peril Health” and the sub-headlines “Cancer Link Cited” and “Smoking Is Also Found Important Cause of Bronchitis”. Besides the front-page headlines, the Sunday edition was rife with stories on the ‘revelation’ that smoking wasn’t good for you.
As much as the tobacco companies tried for decades to convince consumers otherwise, anyone with a minimal amount of intelligence who had ever smoked a cigarette probably already knew that it wasn’t something you did in order to get yourself into shape or good health. As far back as the 1940s, scientists had already made the link between smoking and lung cancer. Smoking was considered a vice for a reason! Even as many (or most) Americans already knew of the dangers of smoking, an official statement from the Federal government was a big deal, though, and would pave the way for more regulation of the sector. If you owned tobacco stocks heading into that weekend, you probably weren’t looking forward to Monday’s opening bell.
When the bell rang Monday morning, tobacco stocks opened lower, but by the end of the trading day, their performance was a surprise to most. Of the five major tobacco companies at the time, Reynolds American actually finished the day higher, and American Tobacco was unchanged on the day. Of the remaining three major tobacco stocks, none of them even finished the day down 2%. Perhaps the most amusing aspect of the New York Times market recap the following morning was that cigar stocks traded higher on the day as “cigar smoking received a relatively clean bill of health”. It looks like at least one part of the industry had effective lobbyists!
The performance of the cigarette stocks on the first trading day after the Federal Government first officially recognized the dangers of smoking illustrates once again how the market can defy consensus expectations. While the Surgeon General’s report on the dangers of smoking should have been a blow to cigarette stocks, the initial reaction to the report was muted. When everyone is zigging, the market often zags.

Our Morning Lineup keeps readers on top of earnings data, economic news, global headlines, and market internals. We’re biased (of course!), but we think it’s the best and most helpful pre-market report in existence!
Start a two-week trial to Bespoke Premium to read today’s full Morning Lineup.
The Closer – Air Out of Gas, Fed Shifts, Inflation That Matters, 3y Auction – 1/10/23
Log-in here if you’re a member with access to the Closer.
Looking for deeper insight into markets? In tonight’s Closer sent to Bespoke Institutional clients, we begin with a look at the fresh 52 week lows for natural gas and the implications for the Energy sector (page 1). We then provide an update of Fespeak’s recent tones (page 2). Afterward, we review the Fed’s preferred measure of inflation ahead of Thursday’s CPI print (page 3). We close out with a recap of today’s record setting 3 year note auction (page 4).

See today’s full post-market Closer and everything else Bespoke publishes by starting a 14-day trial to Bespoke Institutional today!