Fixed Income Weekly: 11/2/22
Searching for ways to better understand the fixed income space or looking for actionable ideas in this asset class? Bespoke’s Fixed Income Weekly provides an update on rates and credit every Wednesday. We start off with a fresh piece of analysis driven by what’s in the headlines or driving the market in a given week. We then provide charts of how US Treasury futures and rates are trading, before moving on to a summary of recent fixed income ETF performance, short-term interest rates including money market funds, and a trade idea. We summarize changes and recent developments for a variety of yield curves (UST, bund, Eurodollar, US breakeven inflation and Bespoke’s Global Yield Curve) before finishing with a review of recent UST yield curve changes, spread changes for major credit products and international bonds, and 1 year return profiles for a cross section of the fixed income world.
In this week’s report we discuss how sensitive the stock market is to near-term rate changes versus terminal rate changes.

Our Fixed Income Weekly helps investors stay on top of fixed income markets and gain new perspective on the developments in interest rates. You can sign up for a Bespoke research trial below to see this week’s report and everything else Bespoke publishes free for the next two weeks!
Click here and start a 14-day free trial to Bespoke Institutional to see our newest Fixed Income Weekly now!
Chart of the Day: Nasdaq Struggles
Bespoke’s Morning Lineup – 11/2/22 – All You Can Eat 75 Bps
See what’s driving market performance around the world in today’s Morning Lineup. Bespoke’s Morning Lineup is the best way to start your trading day. Read it now by starting a two-week trial to Bespoke Premium. CLICK HERE to learn more and start your trial.
“A 75-basis point increase is not something that the committee is actively considering” – Jerome Powell

Below is a snippet of content from today’s Morning Lineup for Bespoke Premium members. Start a two-week trial to Bespoke Premium now to access the full report.
Futures have been fluctuating around the unchanged line this morning, and a stronger-than-expected ADP Private Payrolls report earlier currently has them on the south end of the flatline. Treasury yields are also in a holding pattern ahead of the Fed later today and the 10-year yield is a few basis points above 4%.
In his post-meeting press conference on May 4th, Jerome Powell, after hiking rates by what at the time was an abnormally large 50 basis points (bps), put investors at ease by telling CNBC’s Steve Liesman that the committee wasn’t’ actively considering a 75-bps rate hike. As the headlines the next day read, 75 bps was ‘off the table’. In the six months since those comments were made, it has been an all-you-can-eat buffet of 75 bps hike, and the overwhelming consensus is that today will be the fourth such hike of that magnitude. In fact, CME’s FedWatch tool currently puts the odds of a hike of less than 75 bps at just 12.5%.
What changed after May 4th that caused the Fed to shift direction so sharply? Well, it all started back in early to mid-June when gas prices were up over 50% YTD and a University of Michigan preliminary report showed a surge in inflation expectations. Fed officials became increasingly worried that expectations were becoming unmoored raising fears of a 1970s-type spiral. Since the committee was in a blackout period, they ‘leaked’ news to the WSJ that a 75-bps hike was the likely course of action at its meeting later that week. On the 15th of June, the FOMC did in fact hike rates 75 bps in what would become the first in a run of hikes of that magnitude.
It turns out that June 13th marked the YTD peak in gas prices (they have since declined 25%), and the spike in inflation expectations from the preliminary Michigan Confidence report was revised away. In the historical data, it doesn’t even exist anymore! Even compared to the revised reading for both the 1-year and 5-10 year periods, inflation expectations are lower now than they were in June. In other words, the two primary catalysts for the Fed put a 75 bps hike back on the table have reversed, and yet, the FOMC not only hiked rates 75 bps once but is on pace to hike rates by that amount for a fourth time today.
Who knows where interest rates should or shouldn’t be, but the inconsistency between comments made just six months ago and their actions since then is stark. Markets will likely have notable moves in either direction today based on what Powell and the committee say today, but don’t be too quick to chisel anything into stone.
What we can say for sure is that over the last six months, the move in the 3-month US Treasury yield has been extreme. With an increase of over 325 bps, it has been the largest six-month increase in the yield since May 1981. Going back to 1961, there have only been 147 trading days (less than 1% of all days) where the six-month rate of change was higher than it is now. As shown in the chart below, those readings were from a brief period in 1973 and then intermittently throughout a two-year period from 1979 to 1981.

Our Morning Lineup keeps readers on top of earnings data, economic news, global headlines, and market internals. We’re biased (of course!), but we think it’s the best and most helpful pre-market report in existence!
Start a two-week trial to Bespoke Premium to read today’s full Morning Lineup.
Daily Sector Snapshot — 11/1/22
Chart of the Day – “Broken” Income
Bespoke Market Calendar — November 2022
Please click the image below to view our November 2022 market calendar. This calendar includes the S&P 500’s average percentage change and average intraday chart pattern for each trading day during the upcoming month. It also includes market holidays and options expiration dates plus the dates of key economic indicator releases. Click here to view Bespoke’s premium membership options.

B.I.G. Tips – Fed Day Incoming
Bespoke Stock Scores — 11/1/22
Wild Monthly Moves
Talk about a wild year. Check out the monthly moves in the S&P 500 so far this year. You probabably thought it was volatile in Q1 when the S&P 500 had two declines of 5.3% and 3.1% followed by a gain of 3.6%. Q2 saw even bigger swings with two declines of over 8% sandwiched between the month of May when the S&P 500 was up by the smallest amount possible (0.01%). In Q3, the S&P 500 rallied 9.1% in July, but then gave back all of those gains and more in the subsequent two months. Q4 started off on a positive note with a gain of nearly 8%, but there’s still two months left to give back all of those gains as well.

It’s not often that you see moves of such a large magnitude in the S&P 500, especially when they’re to both the downside and upside. Let’s start with the up moves. October was the second month this year that the S&P 500 rallied 7.5% or more, and while that may not sound like much, it is enough to be tied (with several other years) with the most in the post-WWII period. While there were three years with a higher frequency of 7.5%+ monthly gains in the 1930s (1933, 1935, and 1938), the only other years with as many 7.5%+ monthly moves in the post-WWII period were in 1948, 1954, 1982, 2001, 2009, and 2020.

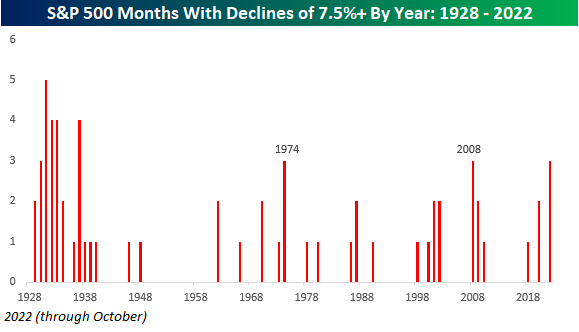
In terms of downside 7.5%+ months, this year has been even more extreme. With three monthly declines of 7.5%+, 2022 is tied with only 1974 and 2008 for the most in any post-WWII year. The only years with more were all in the 1930s (1932, 1933, 1934, and 1938).
Combining the two series together is where things really start to get interesting. With five monthly moves of at least 7.5% in either direction, there hasn’t been a single year in the post-WWII period with more- and there are still two months left to go. The only years with a higher number of 7.5% monthly moves were 1931, 1932, and 1932. While market-makers (are there any of those anymore) may be loving the volatile trading environment of 2022, most investors probably can’t wait to wipe the slate clean in 2023. Click here to learn more about Bespoke’s premium stock market research service.

Bespoke’s Morning Lineup – 11/1/22 – Even the Yen is Up
See what’s driving market performance around the world in today’s Morning Lineup. Bespoke’s Morning Lineup is the best way to start your trading day. Read it now by starting a two-week trial to Bespoke Premium. CLICK HERE to learn more and start your trial.
“For every moment of triumph, for every instance of beauty, many souls must be trampled.” – Hunter Thompson
Below is a snippet of content from today’s Morning Lineup for Bespoke Premium members. Start a two-week trial to Bespoke Premium now to access the full report.
After the best month for the DJIA since 1976 (and a strong but not nearly as notable month for the S&P 500 and Nasdaq), the markets are looking to kick off November on the same bullish footing as both the S&P 500 and Nasdaq are on pace to open higher by over 1%. It’s not just US stocks that are rallying either. Chinese stocks surged overnight on rumors that the country would relax its COVID restrictions, and the gains followed right into the European markets as major averages on the continent are up over 1% across the board. Bond yields are also lower and commodities are rallying. In fact, just about everything except for the dollar is trading higher this morning. Even the yen is up!
There are three economic reports on the calendar this morning, and they’re all at 10 AM. The JOLTS report is lagged a month (September), but that will be an important indicator to watch to see if there’s any follow-through from last month’s big drop. A decline well below 10 million would be just what the Fed would want to see heading into this week’s meeting. Also at 10 AM, we’ll get September Construction Spending which is expected to fall by 0.6% compared to last month’s decline of 0.7%, and most importantly, the ISM Manufacturing report is expected to decline right to 50.0. Anything below that would indicate a contraction in the manufacturing sector.
Earnings season is barely half over, but already it’s been a memorable one. Think about this for a minute. While Apple (AAPL) managed to buck the trend and rally over 7% in reaction to its earnings report last week, the other mega-caps in the S&P 500 like Alphabet (GOOGL), Amazon.com (AMZN), Microsoft (MSFT), and Tesla (TSLA) all fell 7% or more in reaction to their reports. Additionally, Meta (META), which is no longer a mega-cap because it fell so much, lost a quarter of its market cap in a single day! Despite the pummeling in the S&P 500’s largest stocks, the index is still up over 6% this earnings season. Talk about resilience!
The chart below compares the performance of the S&P 500 at this point in earnings season to the same point (24 calendar days) in each prior earnings season since the start of 2009. The 6.4% rally so far ranks as the best since Q3 2011. Going back to the start of 2009, there have only been two other earnings seasons where the S&P 500 was up more at this point in the reporting period, and there were only a total of five where it was up more than 5%. Now, just because equities have done well this reporting period doesn’t mean it’s off to the races from here (last earnings season the S&P 500 also performed well only to crater from late August through early October), but the market’s ability to rally with no help from its ‘generals’ is impressive.

Our Morning Lineup keeps readers on top of earnings data, economic news, global headlines, and market internals. We’re biased (of course!), but we think it’s the best and most helpful pre-market report in existence!
Start a two-week trial to Bespoke Premium to read today’s full Morning Lineup.