The Bespoke Report — Equity Market Pros and Cons — Q1 2023
This week’s Bespoke Report is an updated version of our “Pros and Cons” edition for Q1 2023.
With this report, you’re able to get a complete picture of the bull and bear case for US stocks right now. It’s heavy on graphics and light on text, but we let the charts and tables do the talking!
On page three of the report, you’ll see a full list of the pros and cons that we lay out. Slides for each topic are then provided on page four and beyond.
To read this report and access everything else Bespoke’s research platform has to offer, start a two-week trial to Bespoke Premium.


Daily Sector Snapshot — 1/6/23
Bespoke’s Morning Lineup – 1/6/23 – And the Number is…
See what’s driving market performance around the world in today’s Morning Lineup. Bespoke’s Morning Lineup is the best way to start your trading day. Read it now by starting a two-week trial to Bespoke Premium. CLICK HERE to learn more and start your trial.
“The telegraph would bind man to his fellow-man in such bonds of amity as to put an end to war.” – Samuel Morse

Below is a snippet of content from today’s Morning Lineup for Bespoke Premium members. Start a two-week trial to Bespoke Premium now to access the full report.
In what has been an overall trend of weaker economic data, the monthly non-farm payrolls report has been an oasis. Heading into this morning’s report, the headline reading had come in better than expected for a record eight straight months, and this morning’s stronger-than-expected report extends the streak to nine. The only notable current streak we can think of that has gone longer is the 11 unsuccessful votes to elect a Speaker of the House.

While the headline reading has enjoyed a record streak of better-than-expected readings, the trend heading into this month and which still remains in place is one of weaker momentum. As shown in the chart below, while readings have been positive for the last two years, they have generally been trending lower. Combining the streak of better-than-expected readings with the actual readings in the total number of jobs created, economists were correct in forecasting a slowdown in job growth, but they overestimated the pace of it.
Not only that, but average hourly earnings and the length of the average workweek both came in weaker than expected.
Heading into this morning’s report, other indicators of employment that we saw earlier this week, including the ADP Private payrolls and jobless claims, investors were gearing up for a hot number this morning. The fact that the headline reading only came in 20K above expectations and that wage growth was weaker than expected are both modest positives.

Our Morning Lineup keeps readers on top of earnings data, economic news, global headlines, and market internals. We’re biased (of course!), but we think it’s the best and most helpful pre-market report in existence!
Start a two-week trial to Bespoke Premium to read today’s full Morning Lineup.
Bespoke’s Consumer Pulse Report — January 2023
Bespoke’s Consumer Pulse Report is an analysis of a huge consumer survey that we run each month. Our goal with this survey is to track trends across the economic and financial landscape in the US. Using the results from our proprietary monthly survey, we dissect and analyze all of the data and publish the Consumer Pulse Report, which we sell access to on a subscription basis. Sign up for a 30-day free trial to our Bespoke Consumer Pulse subscription service. With a trial, you’ll get coverage of consumer electronics, social media, streaming media, retail, autos, and much more. The report also has numerous proprietary US economic data points that are extremely timely and useful for investors.
We’ve just released our most recent monthly report to Pulse subscribers, and it’s definitely worth the read if you’re curious about the health of the consumer in the current market environment. Start a 30-day free trial for a full breakdown of all of our proprietary Pulse economic indicators.

Bespoke’s Weekly Sector Snapshot — 1/5/23
Bulls and Bears Back Off
The S&P 500 has seen some choppy price action heading out of 2022 and into 2023, and that has seemed to have sent shivers down the spines of investors. Only 20.5% of respondents to the weekly sentiment survey run by AAII reported as bullish this week. That is down from 26.5% last week and is just shy of the recent low of 20.3% from two weeks ago.
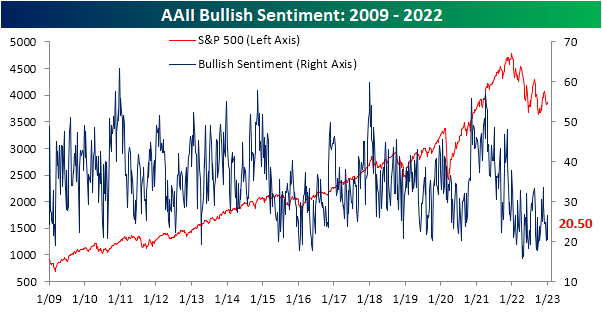
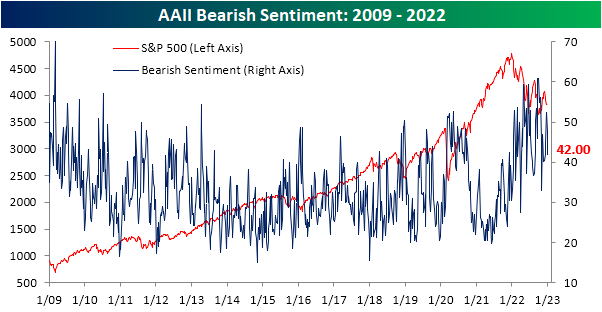
Although bullish sentiment dropped six percentage points week over week, there was not a shift to bearish sentiment as it also fell from 47.6% down to 42.0%. That is the lowest reading since December 8th.
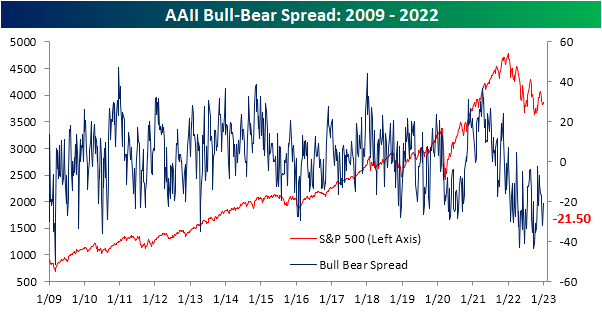
Given both bullish and bearish sentiment fell by similar amounts, the bull-bear spread moved down to -21.5, slightly below the previous week’s reading of -21.1 and extending the record streak of negative bull-bear spread readings to 40 weeks.

With both bullish and bearish sentiment falling, neutral sentiment surged to 37.5% which was the most elevated reading since the last week of March. Additionally, the 11.6 percentage point week-over-week increase was the largest since a 12.6 percentage point surge in July 2018.

Although that may sound like an impressive and notable jump, historically double-digit increases in neutral sentiment in just one week have been followed by somewhat ‘meh’ returns. Both average and median performance are worse than the norm albeit the index has moved higher more than half the time one month to one year out.

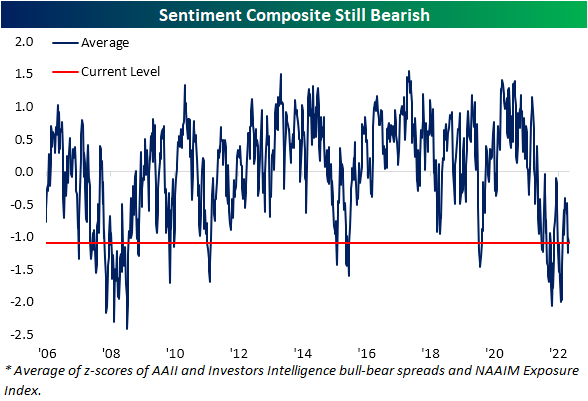
As the AAII survey continues to have an overarching negative tone, the same can be said for other surveys like the Investor’s Intelligence and NAAIM readings. Combining all three of these into a composite, this week’s reading was roughly 1 standard deviation below its historical average. While that implies sentiment is extremely bearish, that is only in the middle of the past year’s range. Additionally, we would note that this composite has been negative (meaning these indicators in aggregate are more bearish than historically normal) for a full year. The only other time period since at least 2006 when that was also the case was in the 54 weeks ending June 2009. Click here to learn more about Bespoke’s premium stock market research service.

Higher Claims on the Horizon?
Unfortunately for equities, between a stronger-than-expected ADP payrolls number and stronger-than-expected jobless claims data, today’s data showed some strength in the US labor market. Honing in on the weekly claims print, initial claims dropped all the way down to 204K this week. That marked a 19K decline from last week’s 2K downwardly revised level of 223K and brings claims to the lowest level since the last week of September when we last saw a sub-200K print. Expectations were calling for the reading to go unchanged from the unrevised level of 225K from last week.

Even continuing claims improved falling to 1.694 million instead of the forecasted increase to 1.728 million. Last week’s reading of 1.71 million had been the highest since February 2022 as continuing claims have steadily risen (at a pace consistent with past recessions) in the past several months.

Although both initial and continuing claims had strong showings, there is the caveat that the current period was smack dab in the middle of the holidays. For starters, that could have some impact on the weekly seasonal adjustment, but more importantly, we would note that those are some of the weeks of the year most prone to revisions.
In the chart below, we show the median revision (expressed as an absolute percent change from the first release) for each week of the year since 1997. The final week of the year has typically experienced a revision of +/-3.8%, tying the week of the July 4th holiday for the largest revision of the year. That means that while claims did show improvement this week, it might not be worth reading too deep into that single number. Further data will be beneficial to help confirm this print (via revisions or lack thereof) as well as provide a clearer picture of the trend, which had been one of deterioration leading into the end of the year.

One other slightly more anecdotal factor worth noting on the stronger-than-expected jobless claims data is that the strong reading this week has gone contrary to the number of layoffs that have made their way into headlines lately. Although the company initially announced the layoffs back in November, Amazon (AMZN) announced today that it plans to lay off a higher number of employees than previously stated (18K versus 10K originally). That also follows an announcement of a significant reduction of roughly 10% of the workforce of Salesforce (CRM) yesterday.
Over the past few months, news story mentions (in data aggregated from Bloomberg) of things like job cuts, firings, and layoffs have surged reaching a high of 16.5K on a four-week rolling average basis in November (around the time of Amazon’s initial announcement). Although that reading has pulled back in the several weeks since then, news counts on the topic remained elevated through the end of 2022 and are likely to get a further bump with this week’s headlines. Over the past decade, these story counts have generally followed the path of both initial and continuing claims. More recently, however, there has been somewhat of a divergence with story counts far outpacing actual claims figures.
That divergence could be for an array of reasons such as workers are quickly finding other roles and not needing to apply for unemployment insurance, but another thing to consider is the timing of the announcement of layoffs versus when they actually happen. For example, in the case of Amazon, while the initial announcement was all the way back in November, those cuts were not planned to go into effect until mid-January. In other words, while not in the data now, higher claims may very well be on the horizon. Click here to learn more about Bespoke’s premium stock market research service.

Chart of the Day: Is Apple (AAPL) Cheap Yet?
Bespoke’s Morning Lineup – 1/5/23 – ADP and Jobless Claims Stronger Than Expected
See what’s driving market performance around the world in today’s Morning Lineup. Bespoke’s Morning Lineup is the best way to start your trading day. Read it now by starting a two-week trial to Bespoke Premium. CLICK HERE to learn more and start your trial.
“Yesterday’s home runs don’t win today’s games.” – Babe Ruth
Below is a snippet of content from today’s Morning Lineup for Bespoke Premium members. Start a two-week trial to Bespoke Premium now to access the full report.
Futures had reversed overnight lows and moved into positive territory earlier, but the stronger-than-expected ADP Private Payrolls report coupled with lower-than-expected jobless claims has pushed equities back in the red. Jobless claims were just released and also came in better than expected on both an initial and continuing basis, and that hasn’t helped the tone heading into the opening bell as the 10-year US Treasury yield has spiked up to 3.75%.
It was a close call but Santa did come this year as the S&P 500 posted a positive return during the seven trading day window (the last five trading days of one year and the first two of the next) when the Santa Claus Rally is said to occur. With a gain of 0.80%, though, it was a smaller-than-normal rally. As shown in the chart, that continues a trend of recent subdued returns during this period. In fact, the last time the S&P 500 rallied more than 2% during the Santa Claus Rally was back in 2013, and that ten-year drought without a 2% rally is the longest since at least 1953 when the five-day trading week on the NYSE in its current form began. Hey Santa, stop being such a cheapskate!

Our Morning Lineup keeps readers on top of earnings data, economic news, global headlines, and market internals. We’re biased (of course!), but we think it’s the best and most helpful pre-market report in existence!
Start a two-week trial to Bespoke Premium to read today’s full Morning Lineup.
Homebuilders Shrugging Off Mixed Data
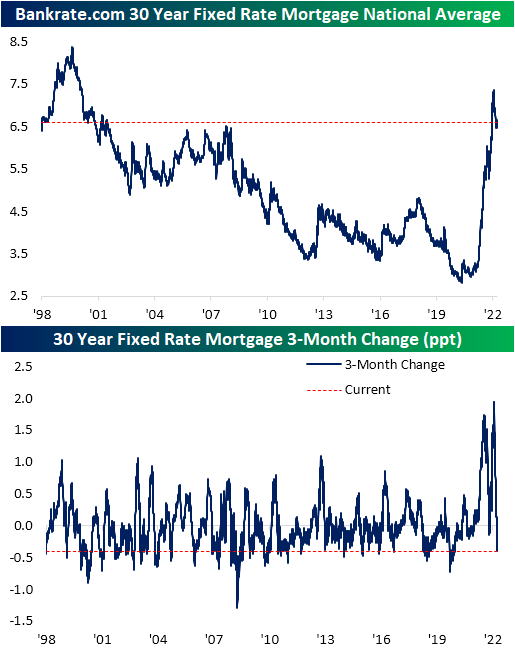
The national average for a 30-year fixed-rate mortgage has come well off its highs falling to 6.6% versus a high of 7.35% in early November. Despite the decline, mortgage rates remain at levels not seen since the early 2000s. We would also note that rates have gone on a series of wild swings in the past year. The second chart below shows the rolling 3-month change since 1998. Whereas most of the year saw rapid increases the likes of which have not been seen in the past quarter century, the current drop of 0.4 percentage points over the past few months has ranked as the largest since late 2020 and is just shy of a bottom decile reading of all periods.
With mortgage rates giving buyers some relief, purchase applications had generally been on the rebound throughout November and December. However, the final week of 2022 saw a large reversal in purchase apps with a 12% week-over-week decline (potentially as a result of residual holiday seasonality) in the largest single-week decline since the last week of September.

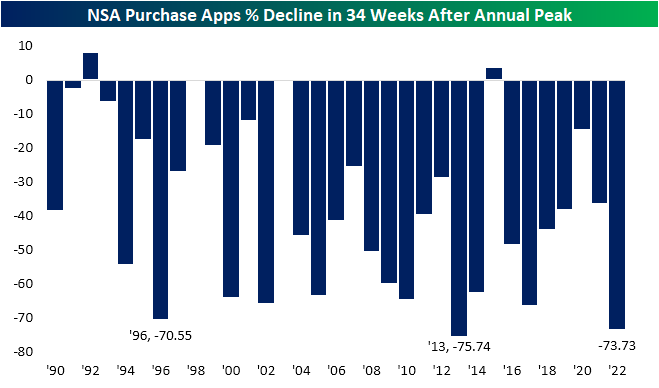
While it is hard to say if the final week of 2022’s large decline was seasonal or a return to purchase apps that are more consistent with readings from earlier in the fall, 2022 tended to follow seasonal patterns. The year began with applications around some of the strongest levels of the past decade and they continued to rise into peak housing season in the spring with applications hitting their pinnacle in the first week of May. The typical seasonal drift was then exacerbated by the added headwind of higher rates, and applications finished the year with the worst reading since 2014 for the comparable week of the year. Additionally, looking at the drop for each year from the annual high through 34 weeks later (second chart), 2022’s percentage drop was the second largest since 1990 behind only the 75.7% decline in 2013.

Refinance applications have continued to hit new lows as this week saw yet another decline down to the lowest level since May 2000.

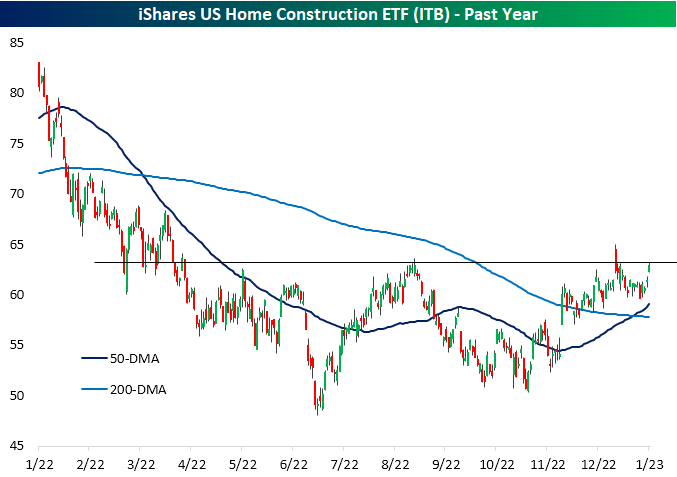
Even though there are some silver linings in recent data, housing activity remains weak. Homebuilder stocks continue to look past that though and continue to shrug off much of the broader market choppiness. The past week has seen the homebuilders, proxied by the iShares US Home Construction ETF (ITB), rally 3.25%. That has largely erased the mean reversion from the second half of December and brings the ETF right up to resistance at the mid-August highs. Click here to learn more about Bespoke’s premium stock market research service.